WikiViz: Visualizing Wikipedia
Introduction
Wikipedia is an interesting dataset for visualization. As an encyclopedia, it's articles span millions of topics. Being a human edited entity, connections between topics are diverse, interesting, and sometimes perplexing - five hops takes you from subatomic particles to Snoop Dog. Wikipedia is revealing in how humans organize data and how interconnected seemingly unrelated topics can be.
During my time at AT&T Labs, which coincidently has a great information visualization group, I started think about how to visualizing something as massive as Wikipedia. With roughly 1.5 million articles (vertices) and tens of millions of article links (edges), a comprehensive visualization package would have to found or built. After playing around with GraphViz, but getting frustrated with layout limitations, I decided on the latter option: build!
I don't buy into the reuse-recycle methodology. That's great for software development, but not research. I believe great ideas and innovations come about by redoing and rethinking existing problems. If you always use what has already been "solved" and built, how do you know it can't be done better?
And so I leaped head first into my own large-scale data visualization project, from scratch. I hope to publish the novel graph layout techniques I developed during this process.

WikiViz v5
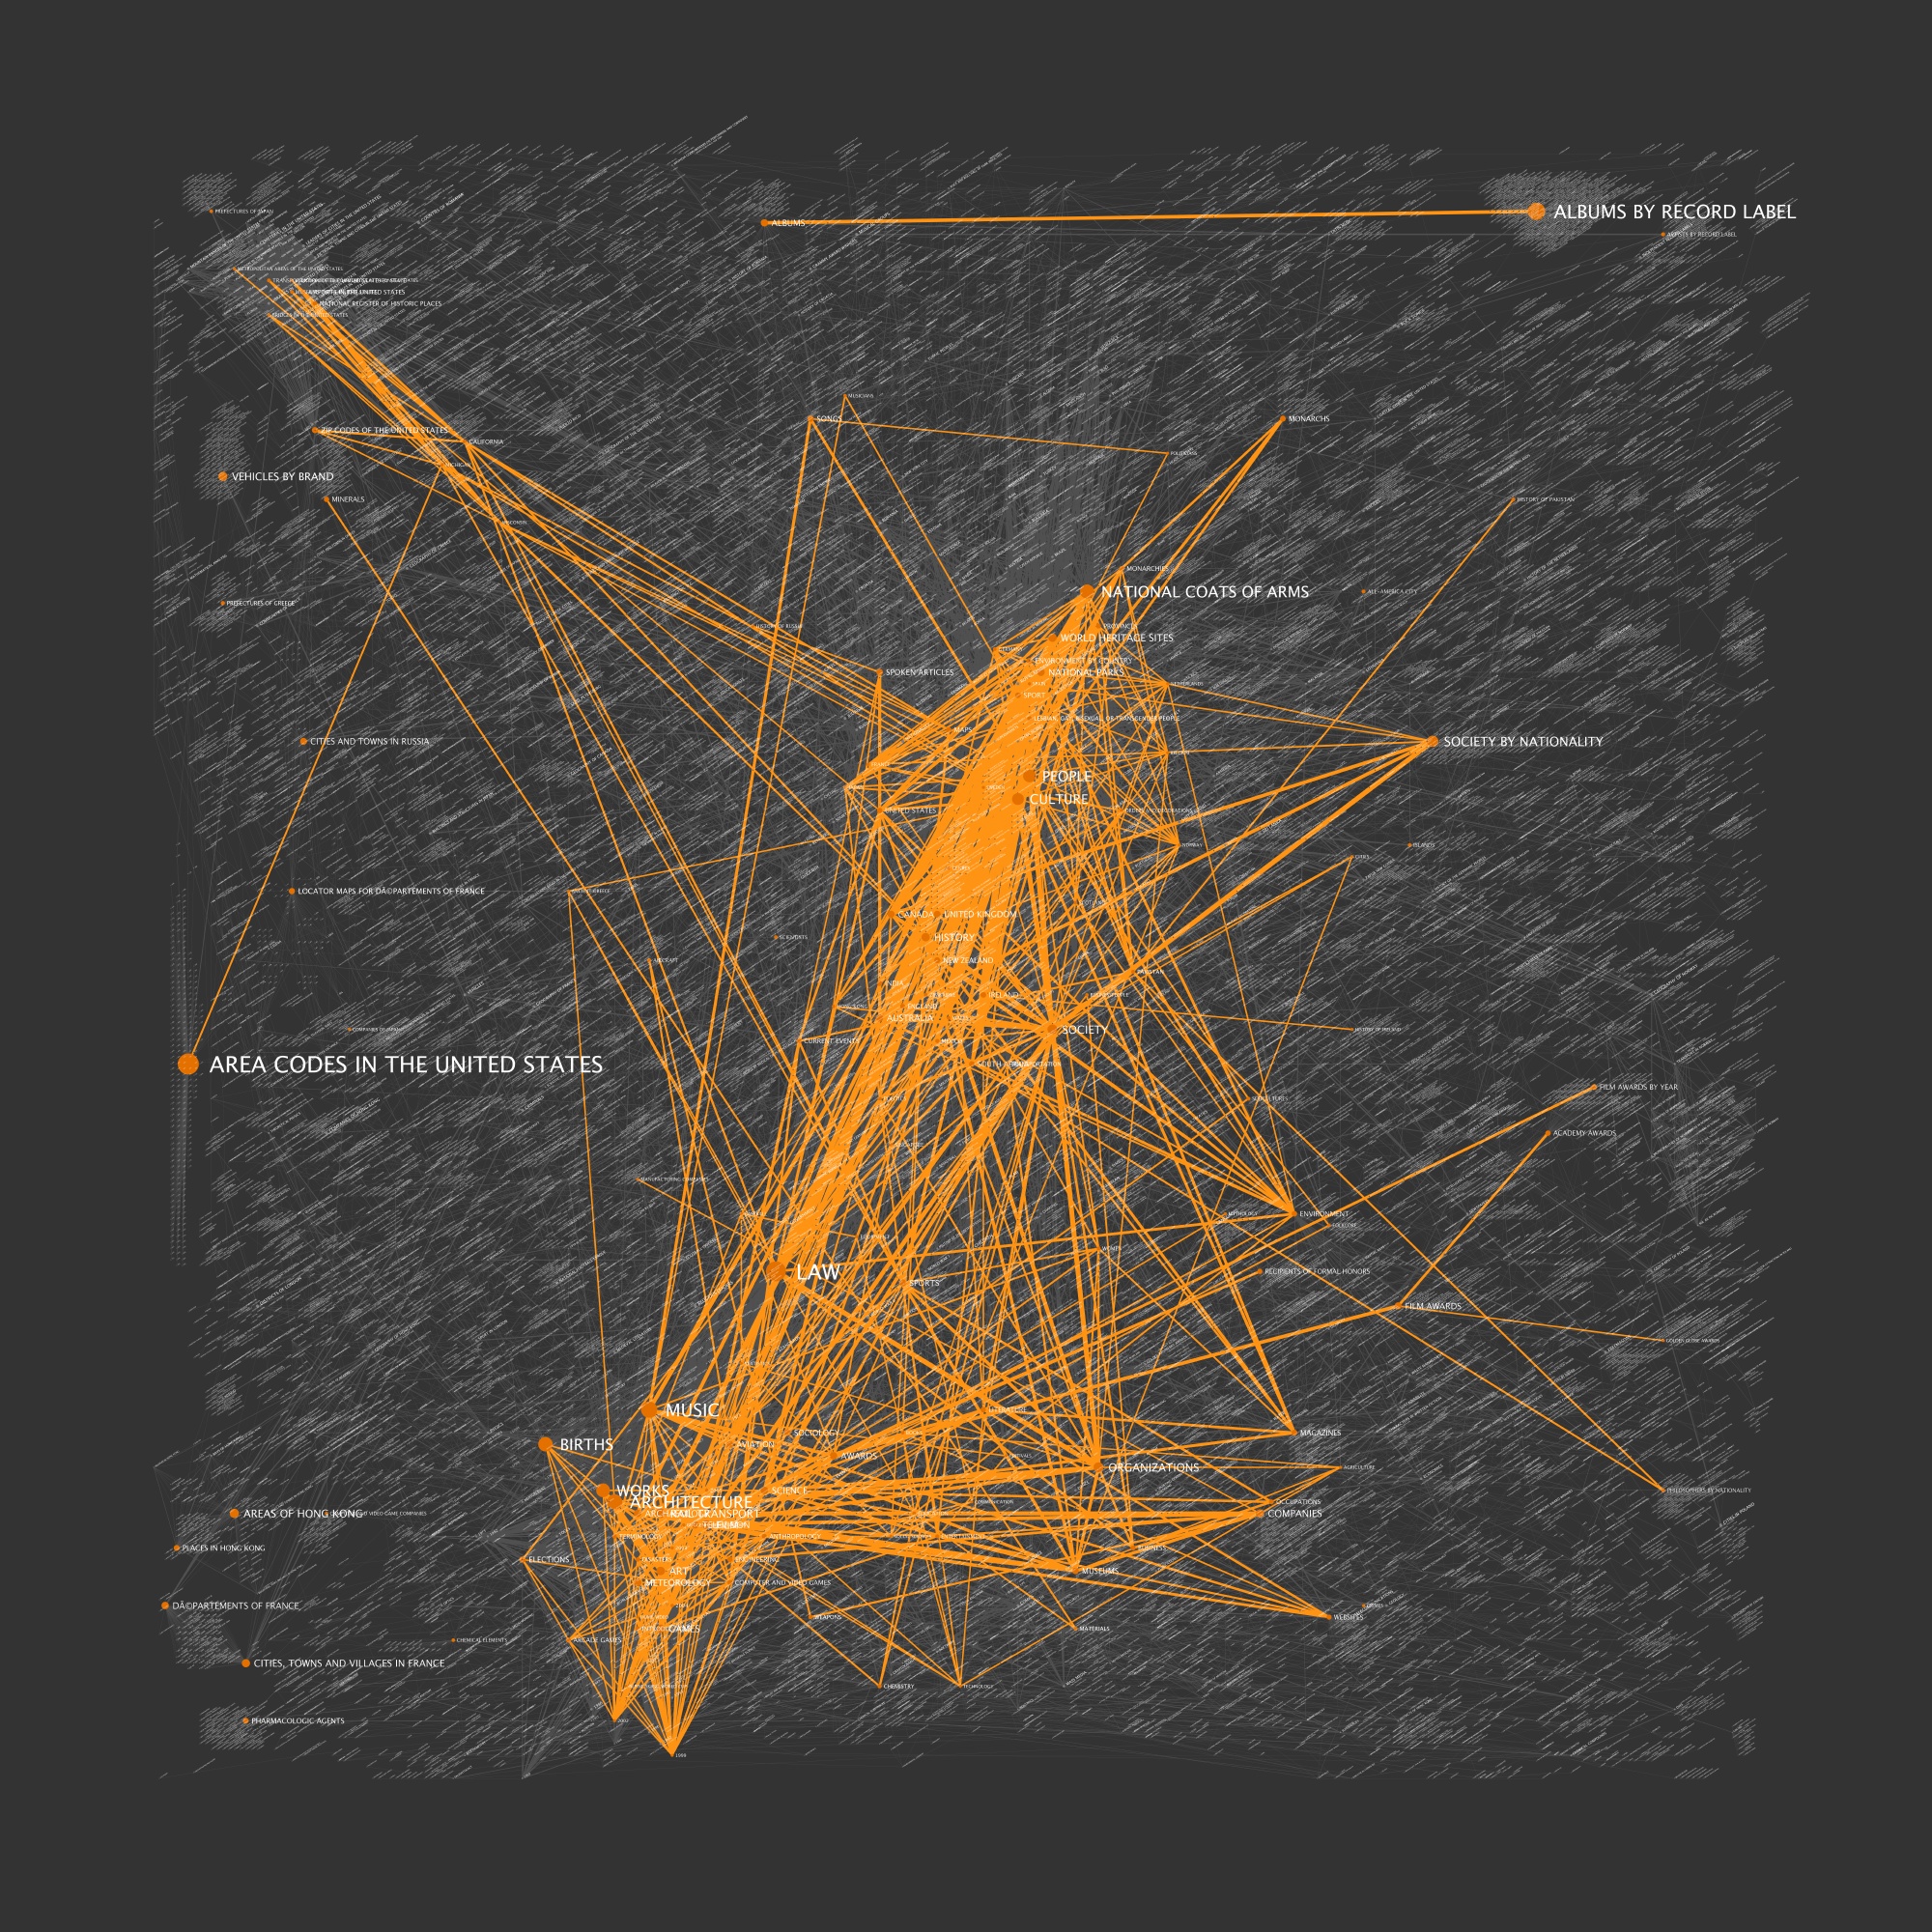
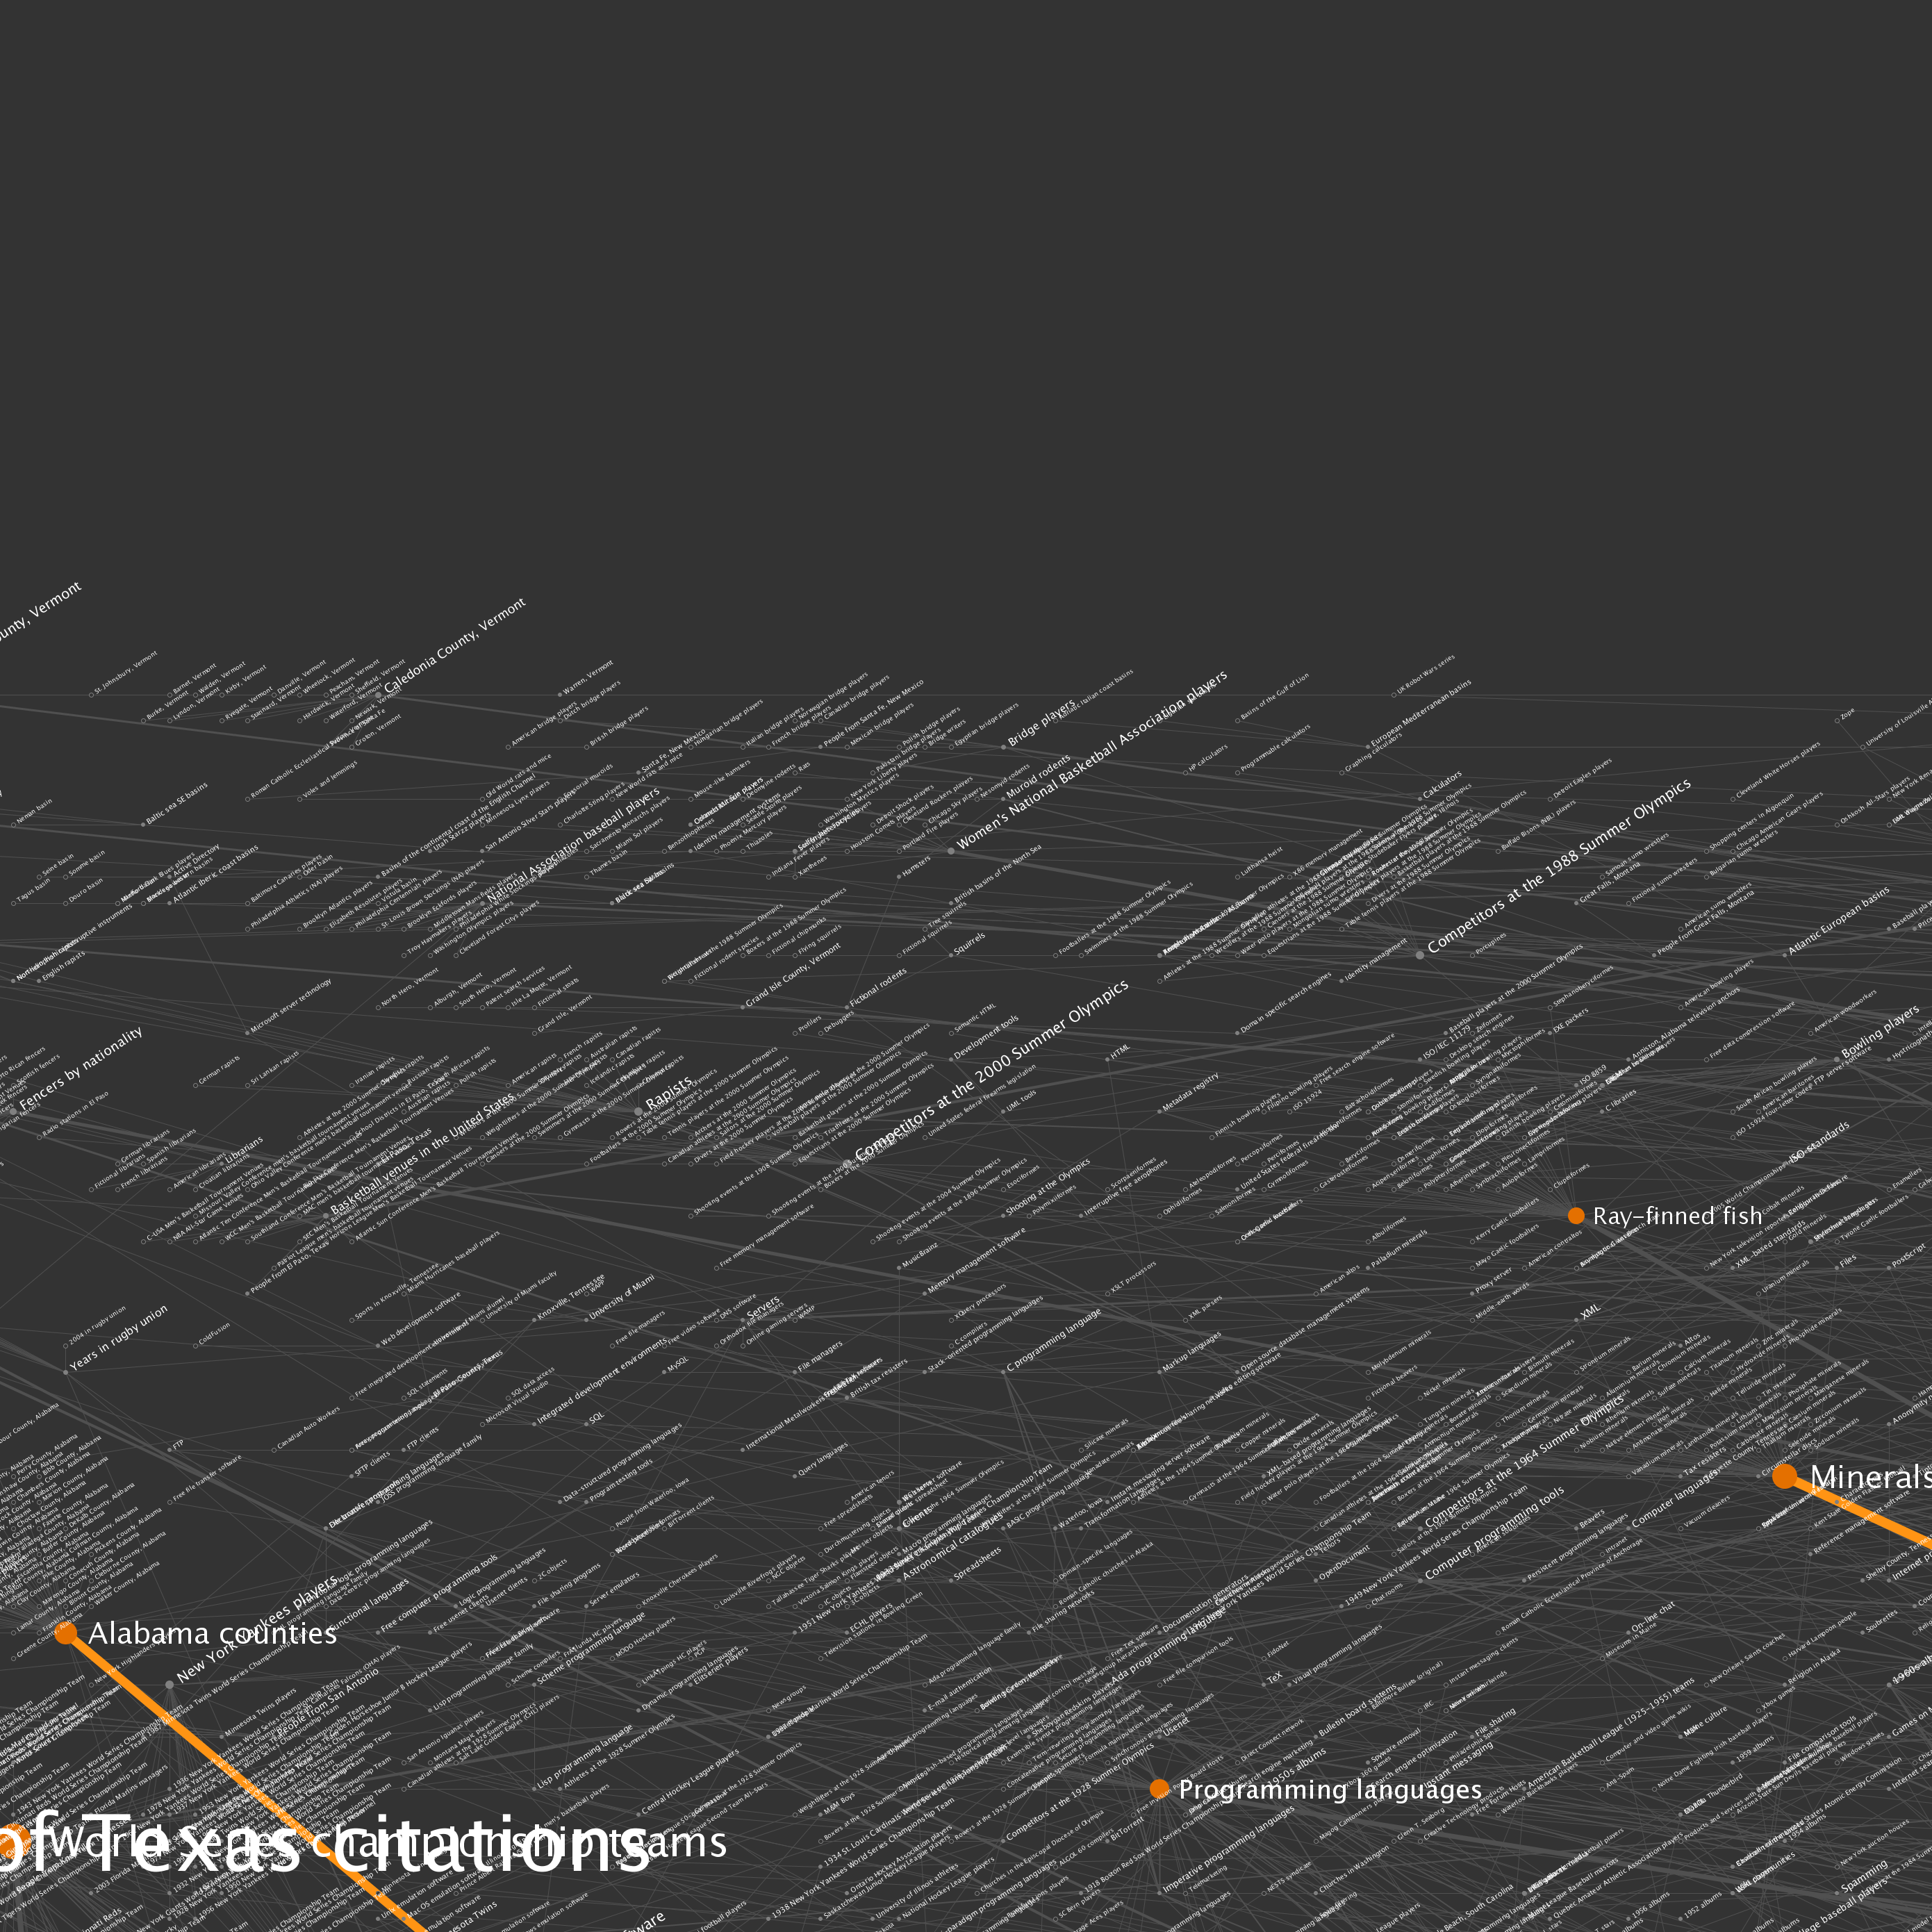
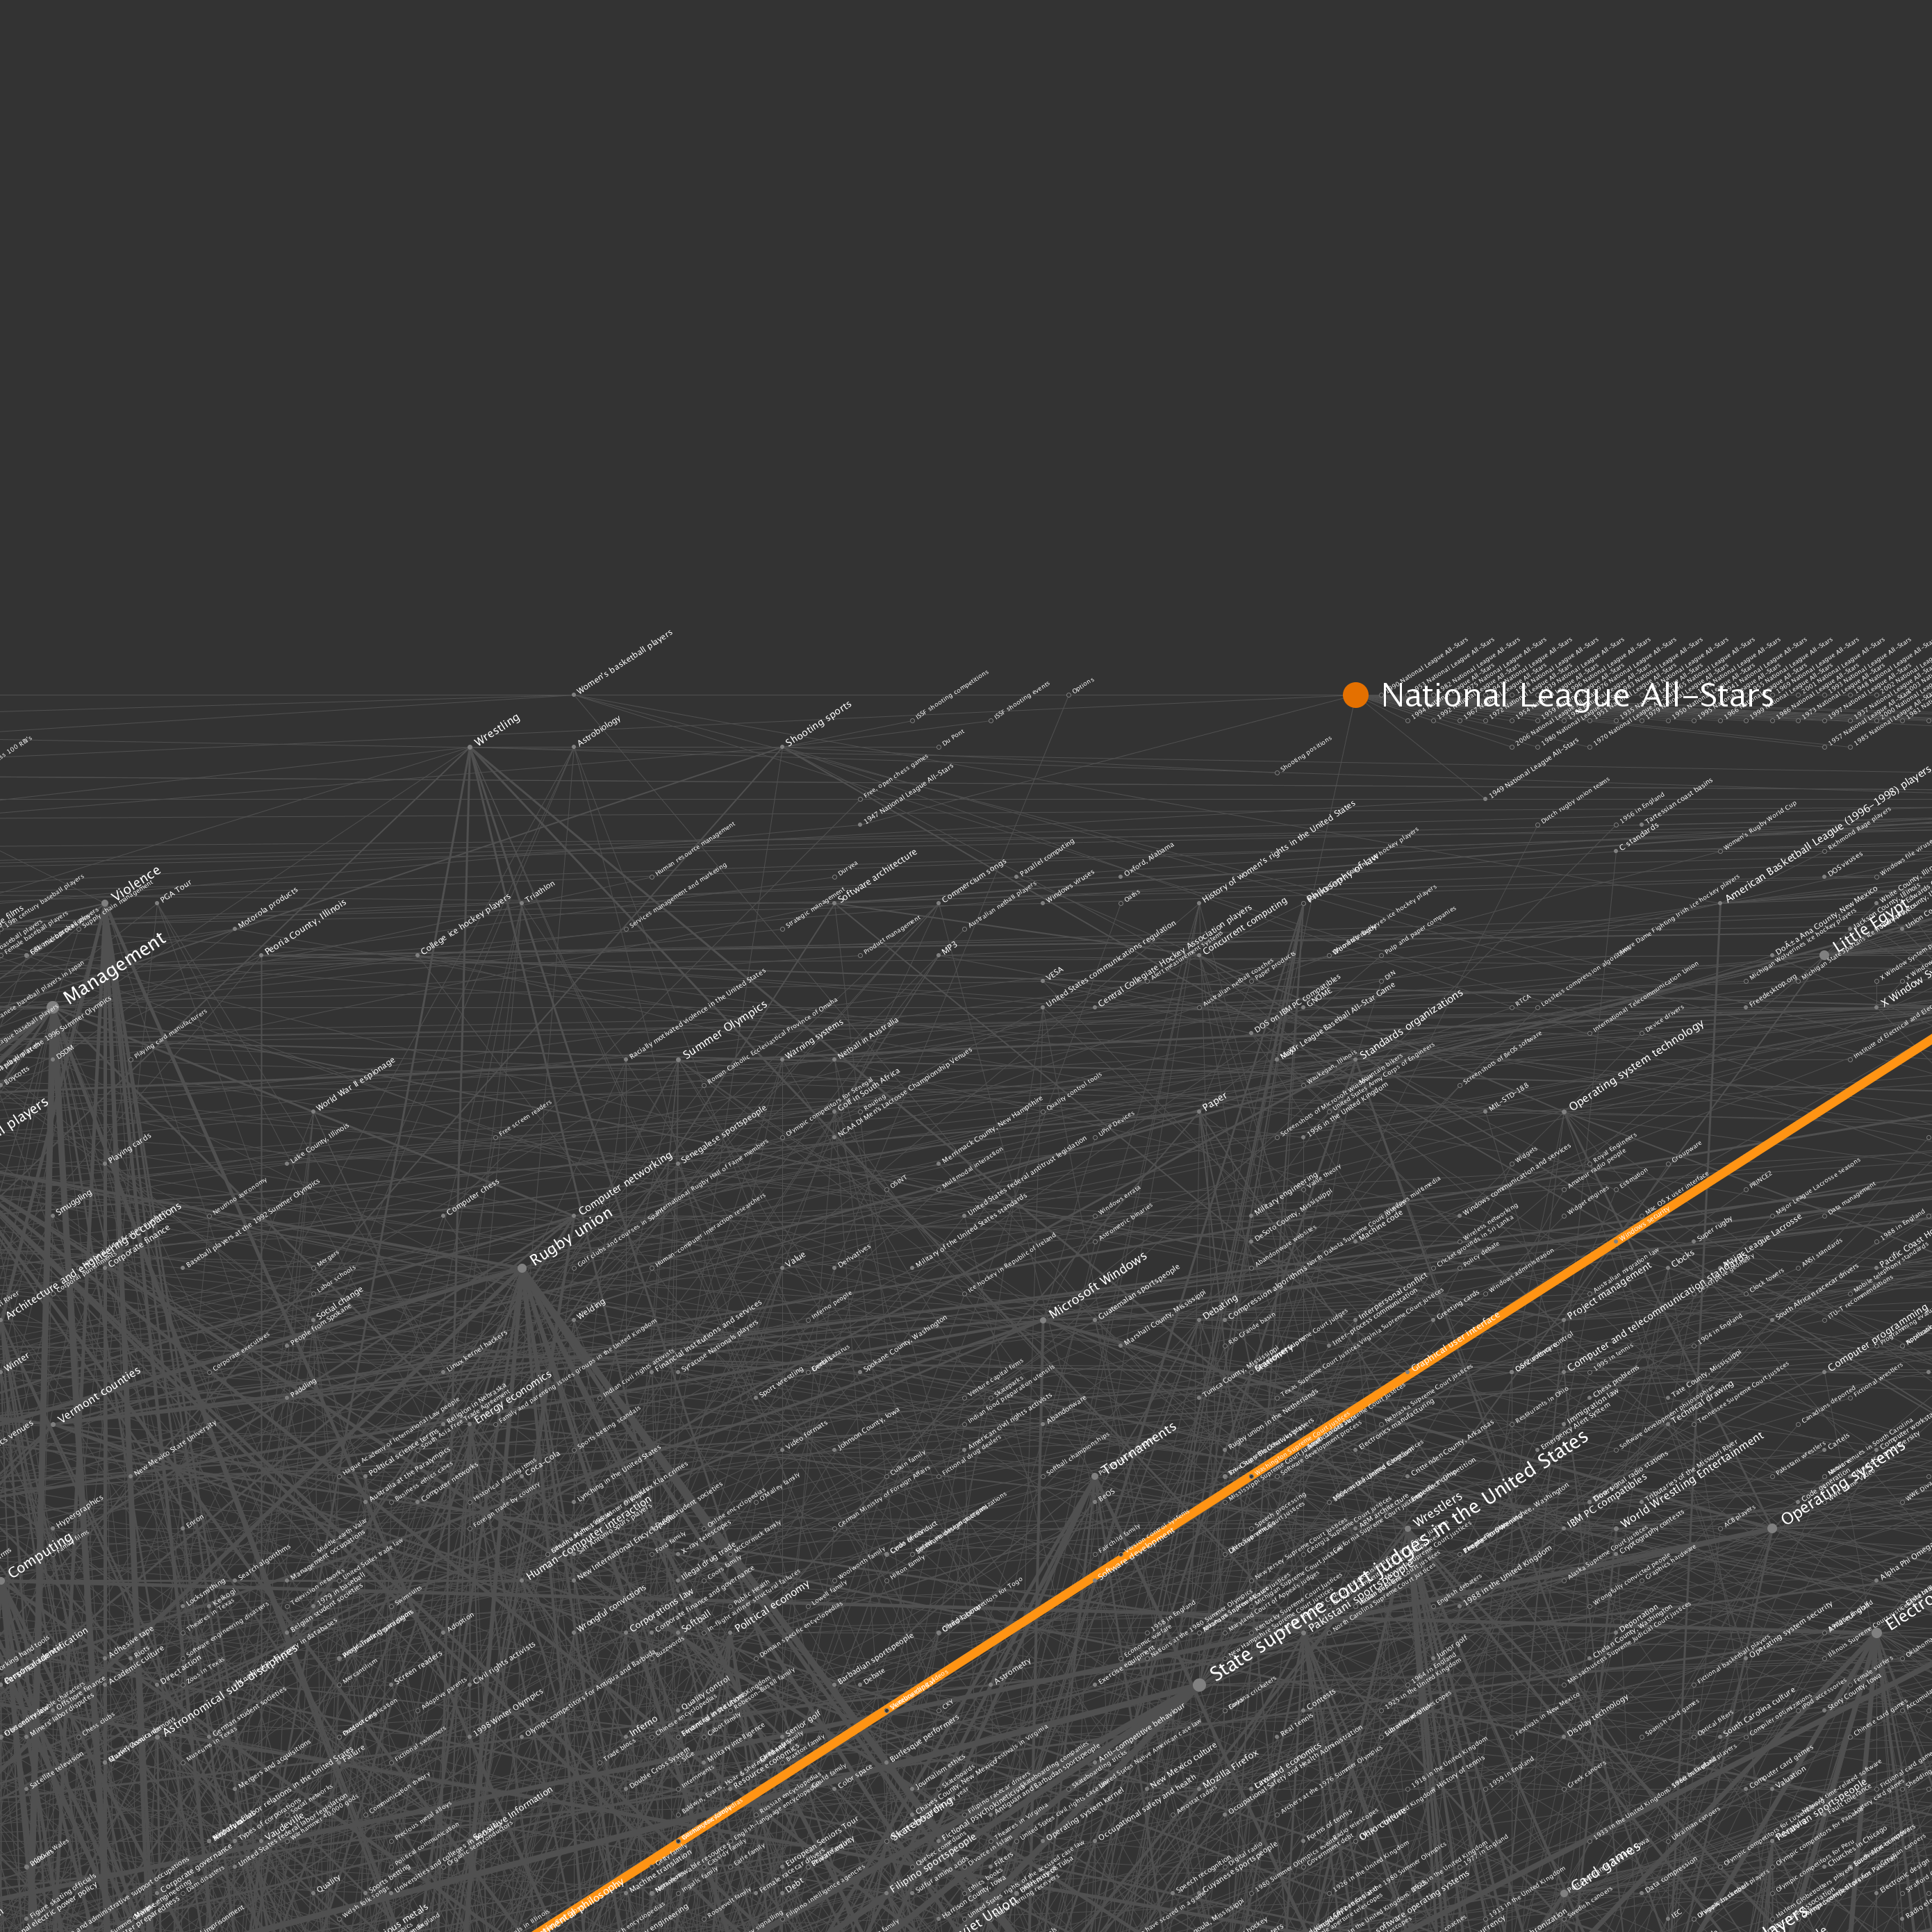
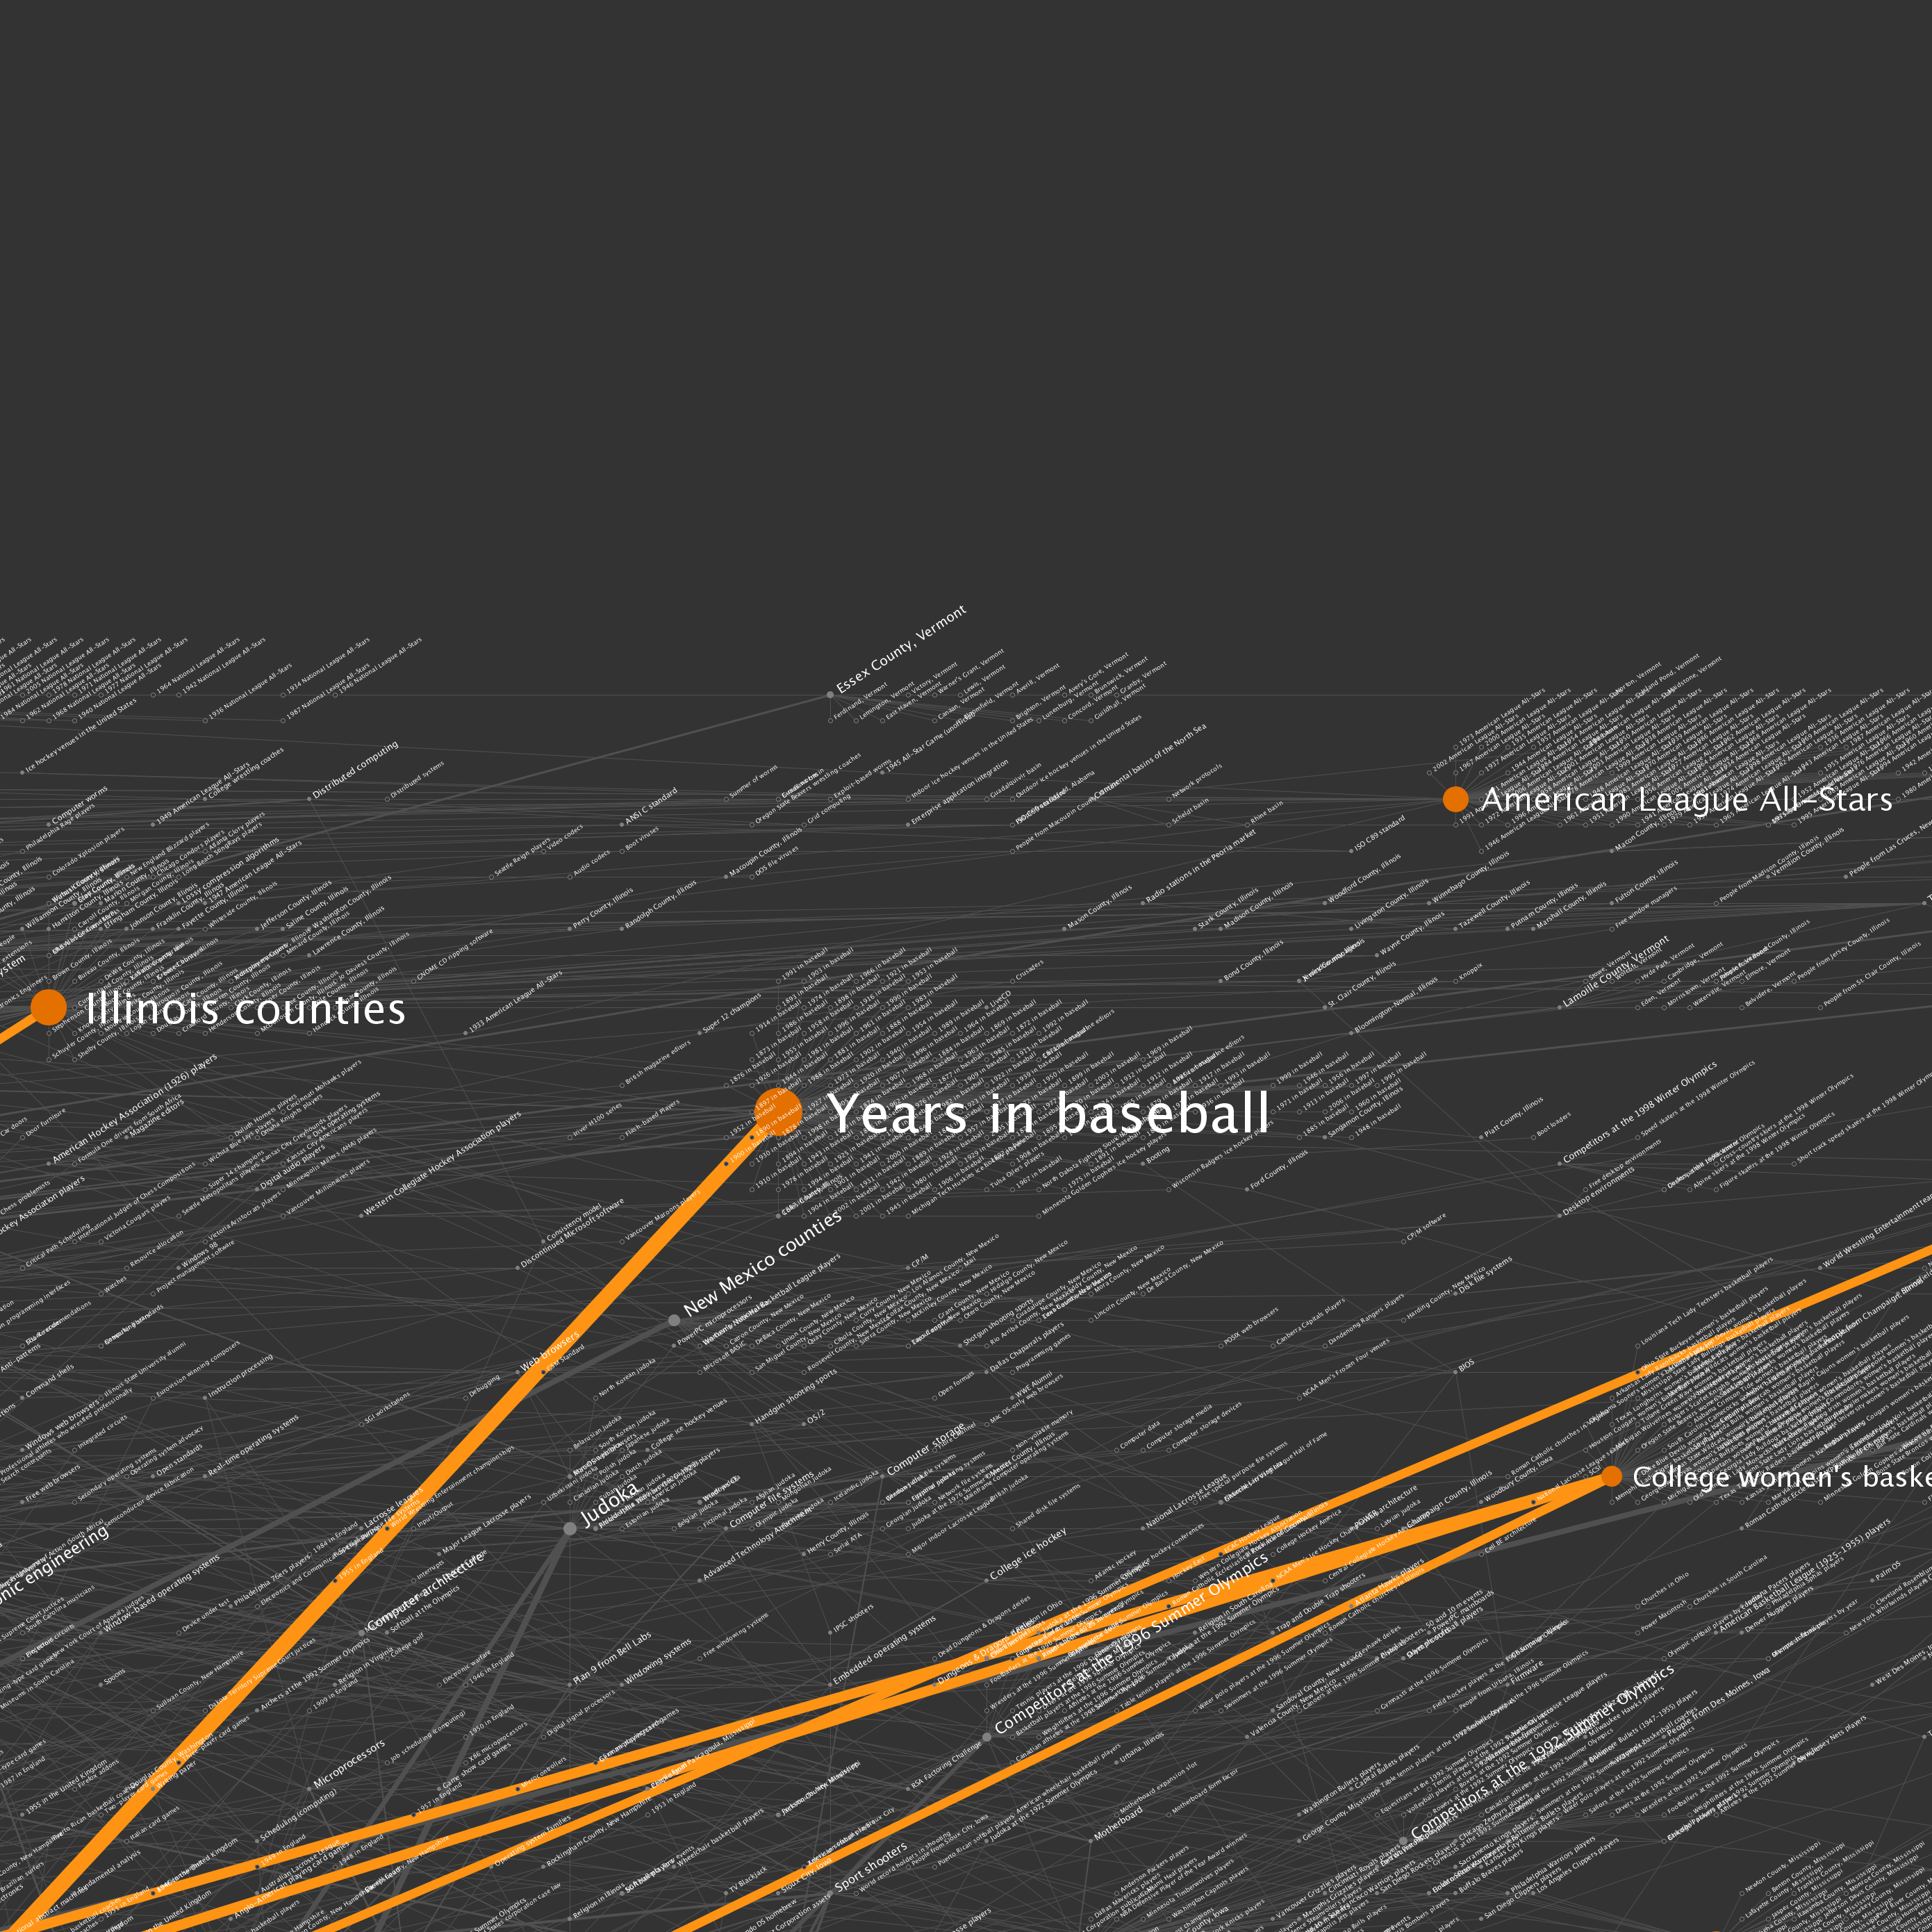
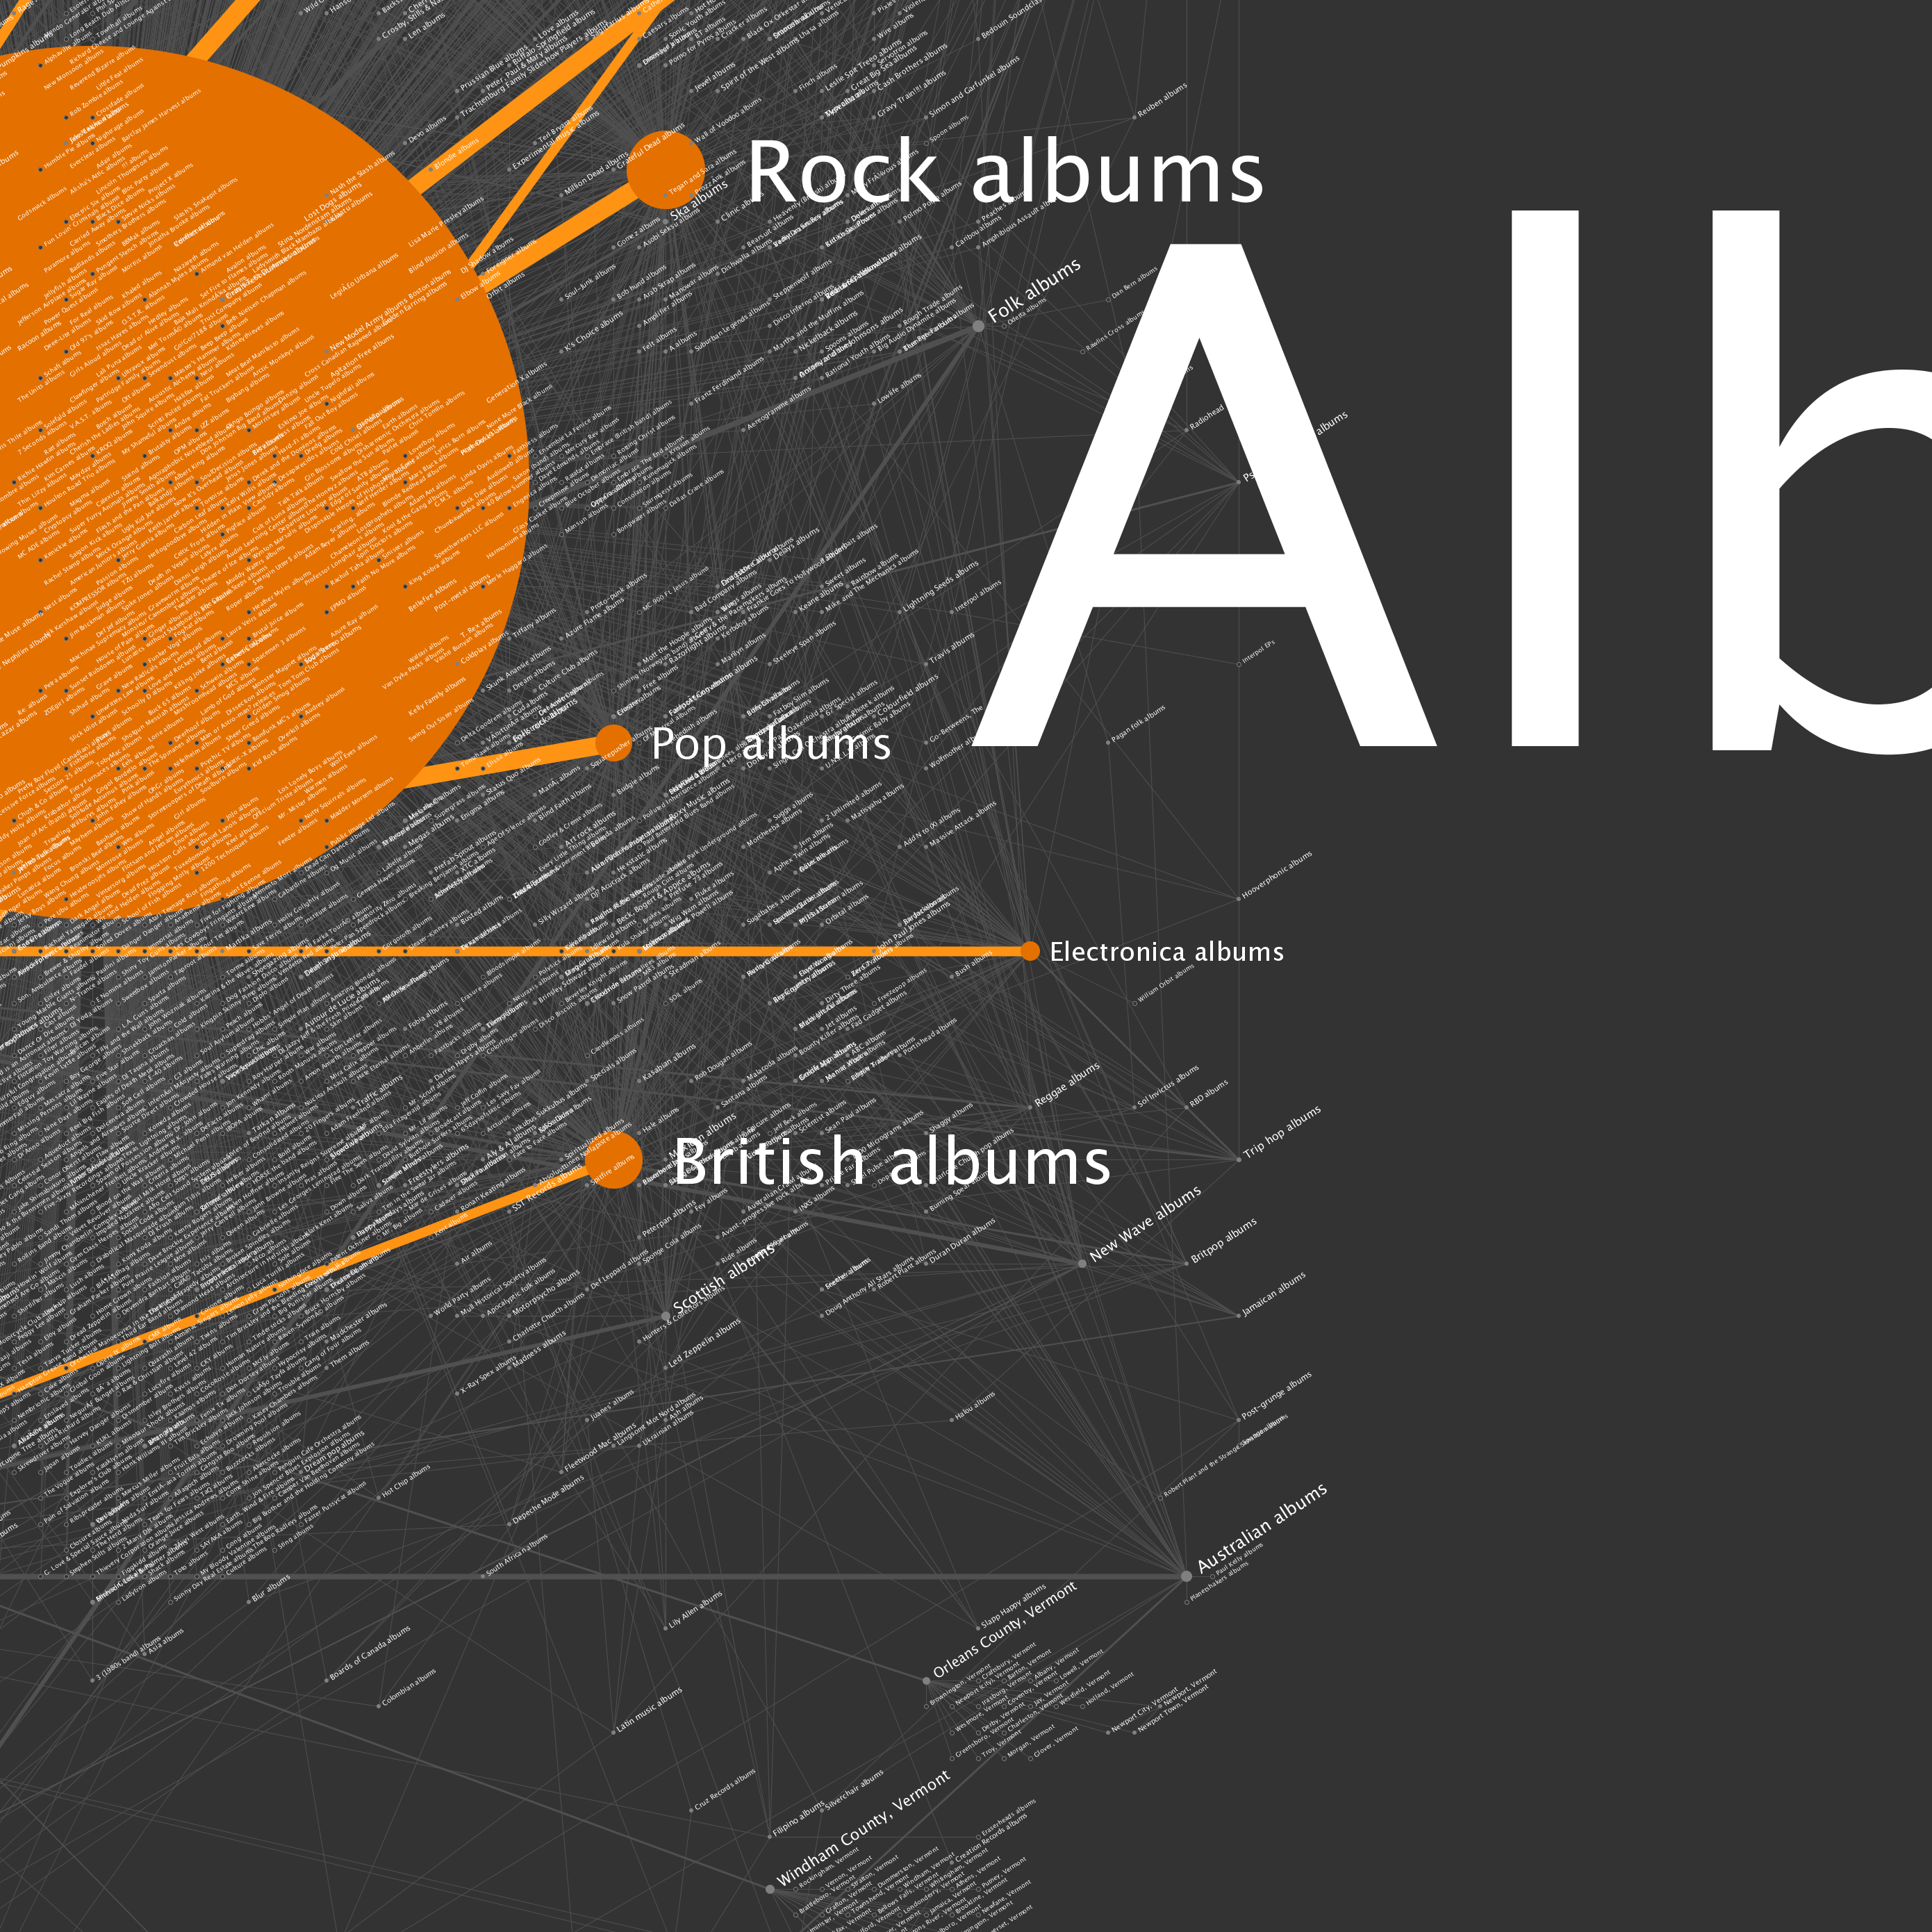
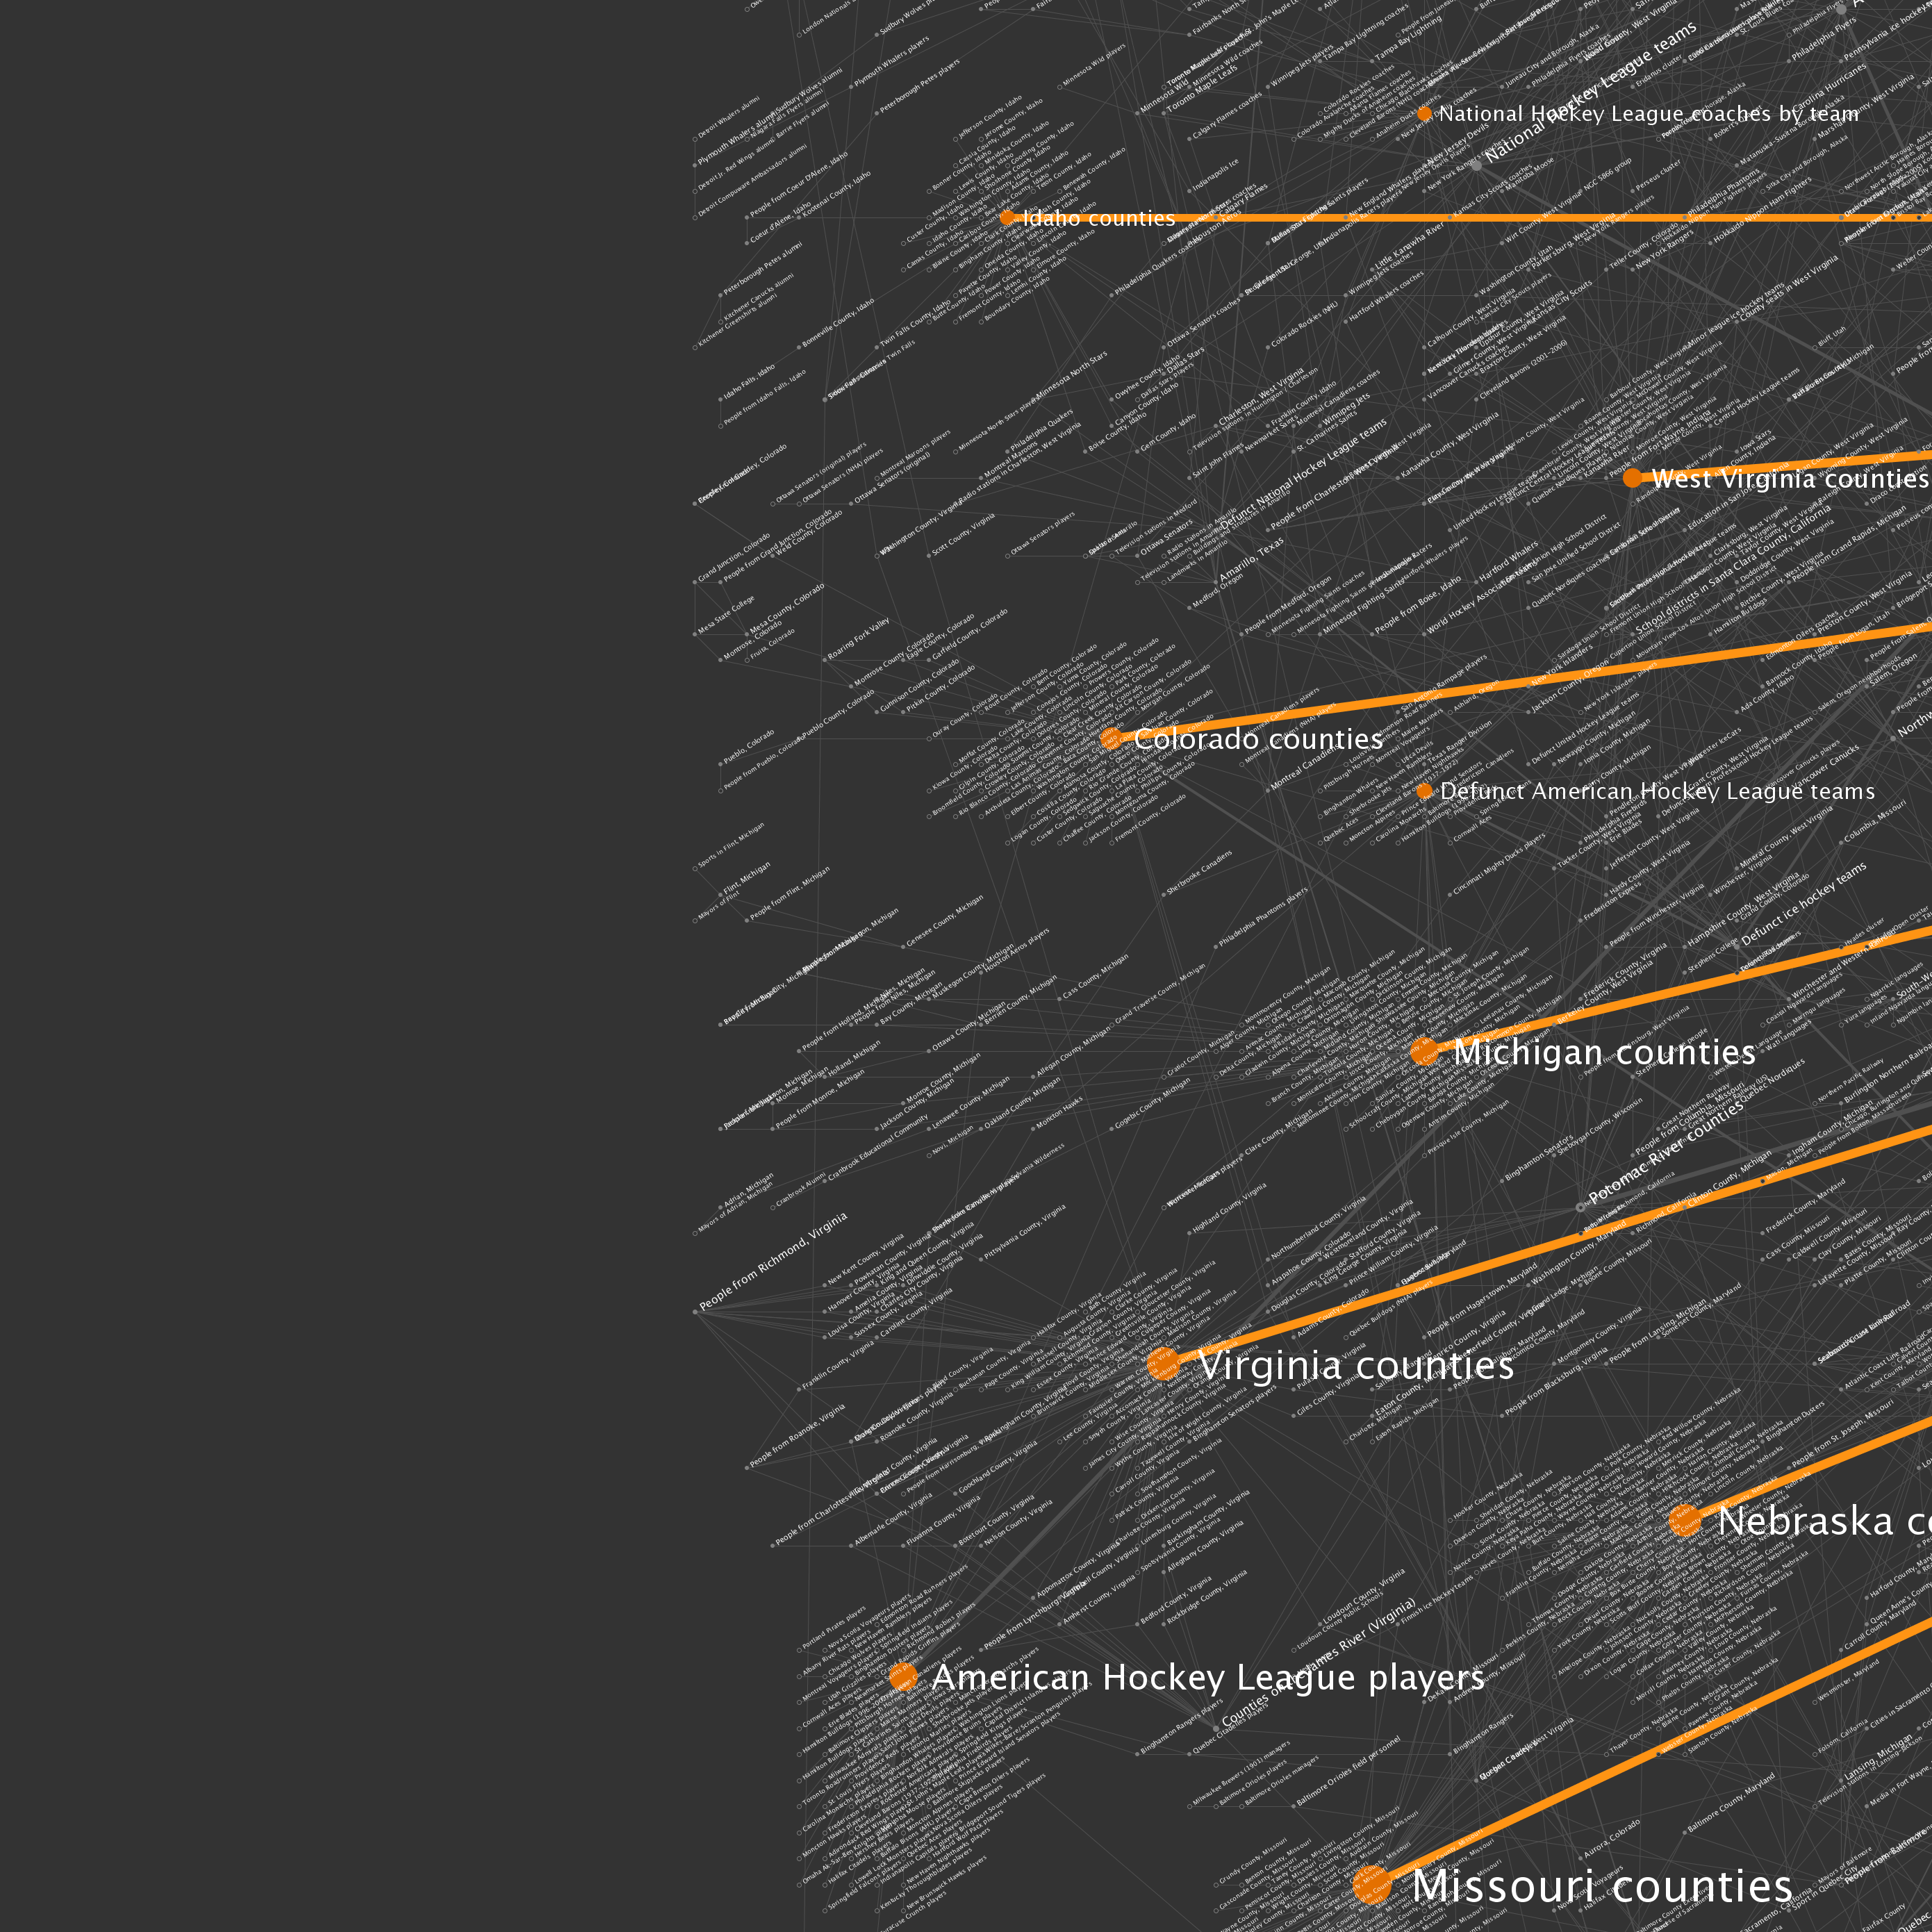
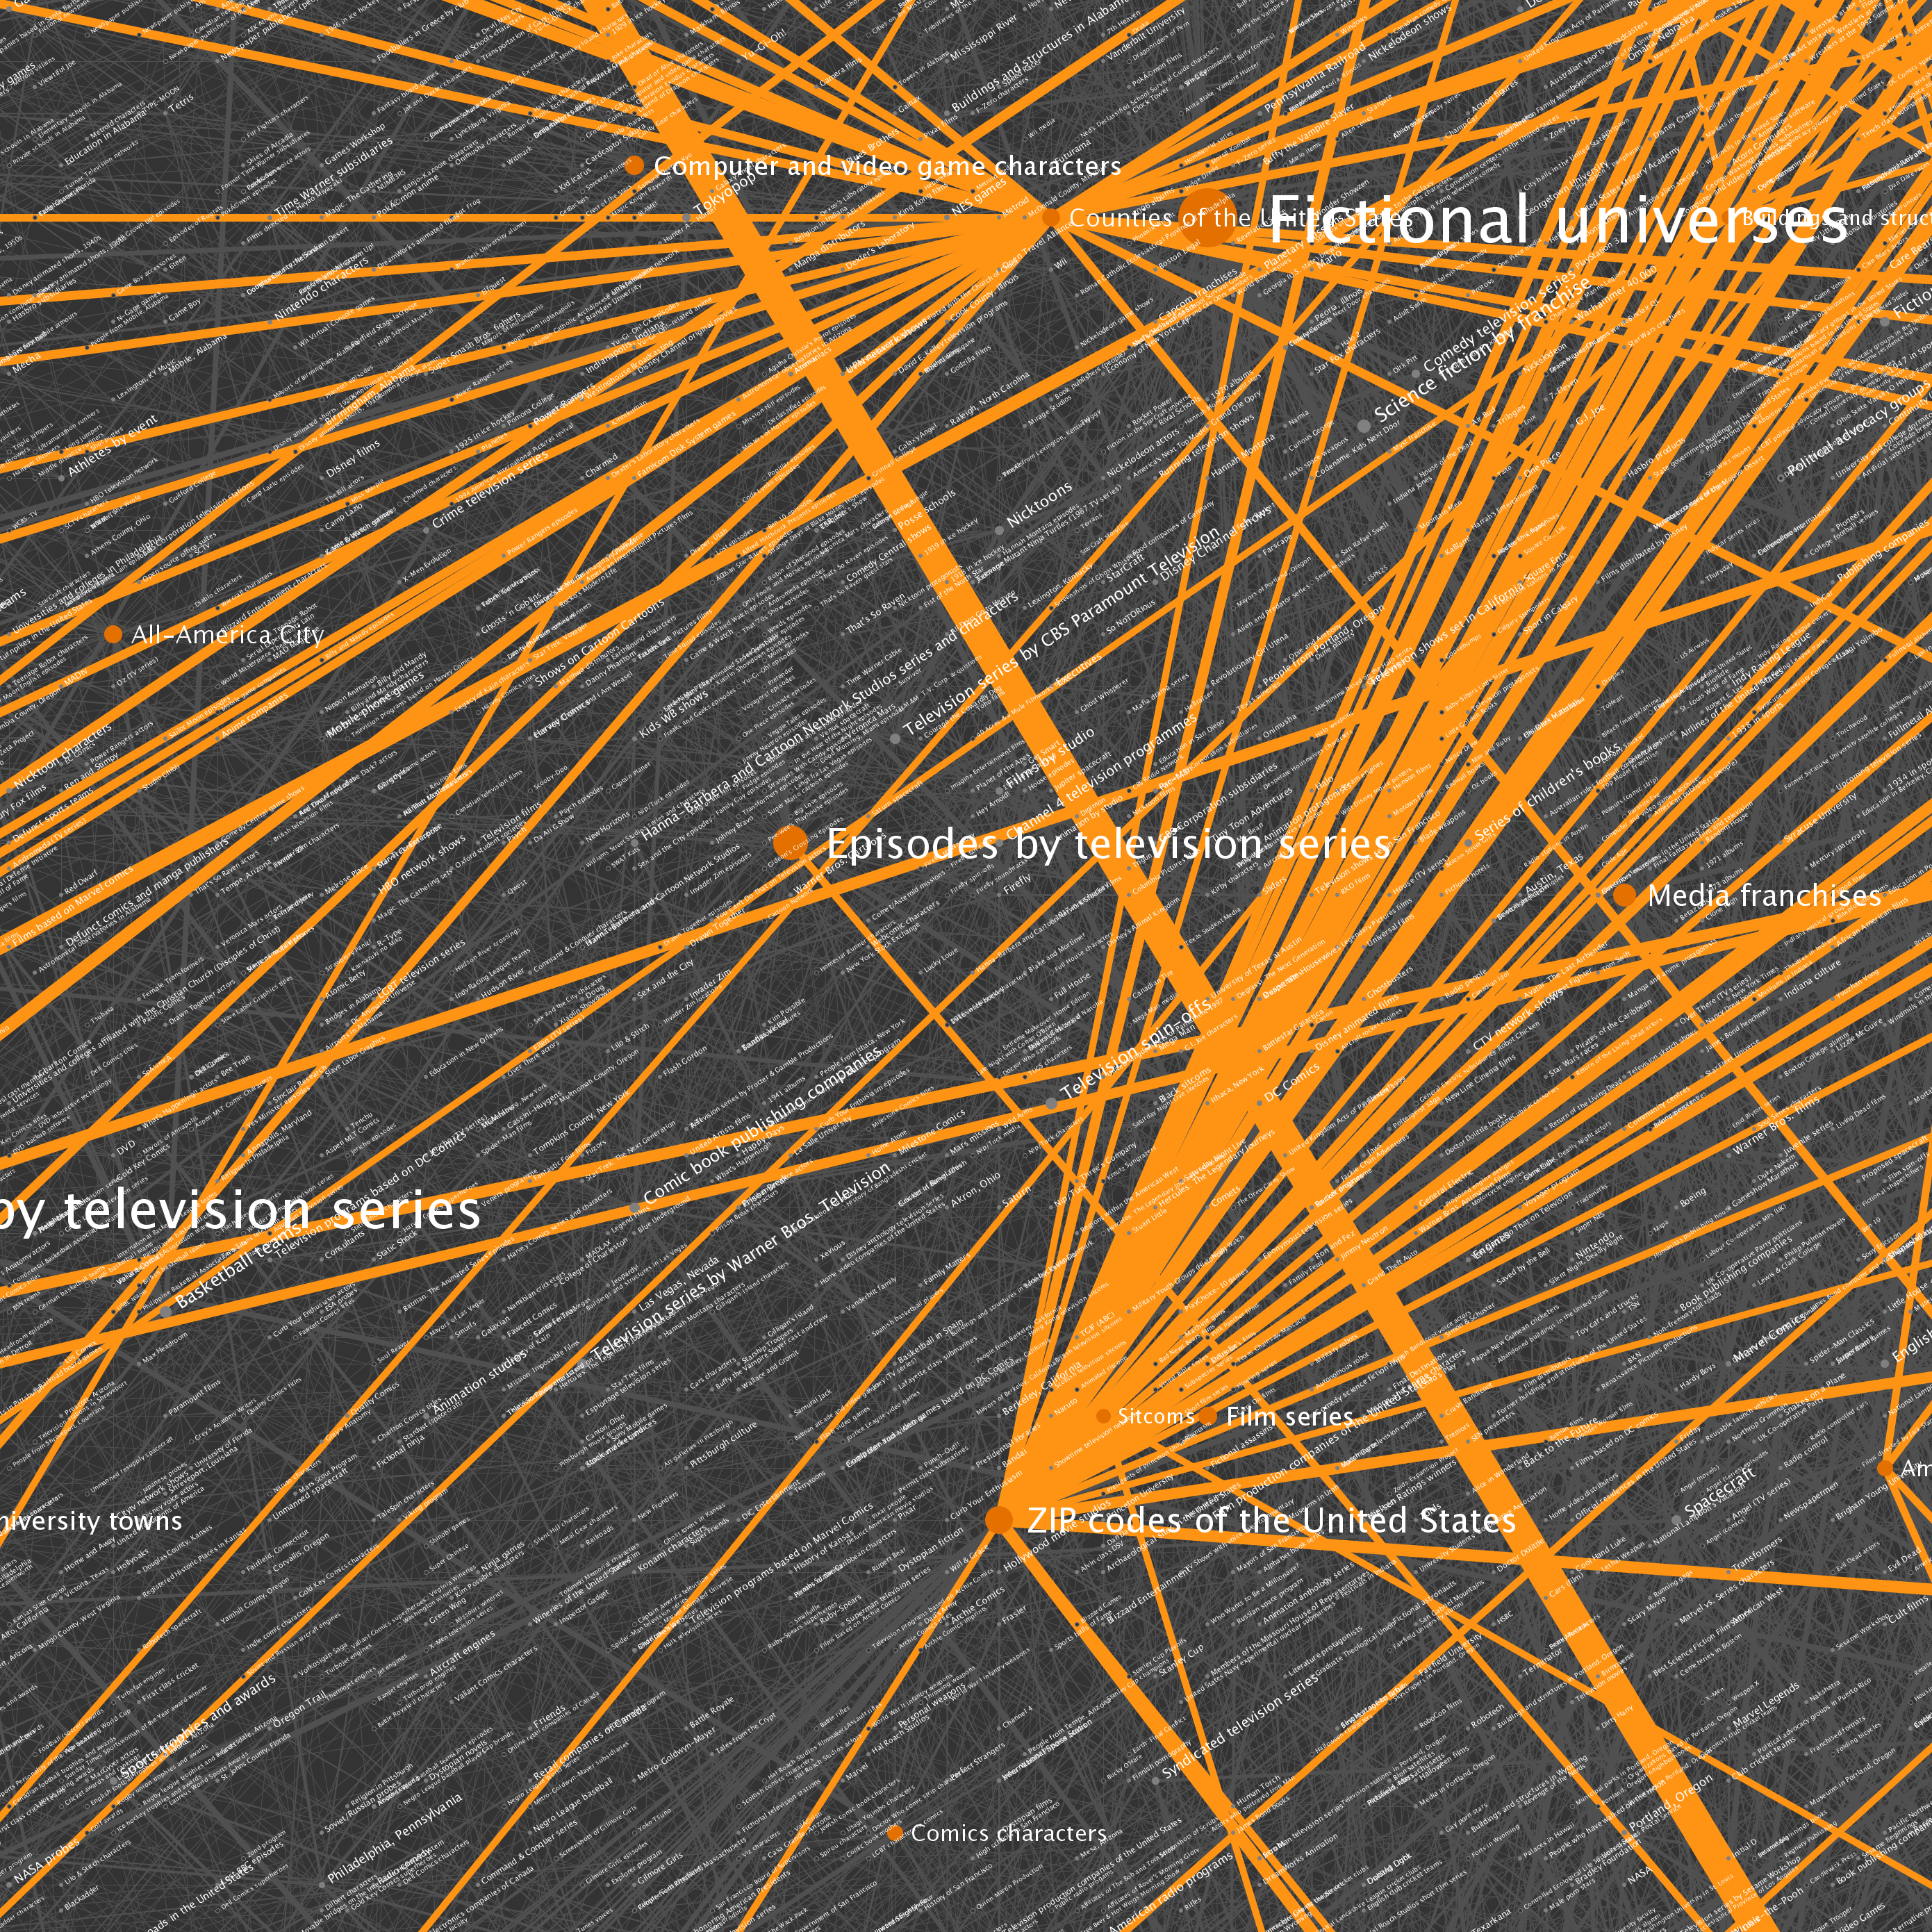
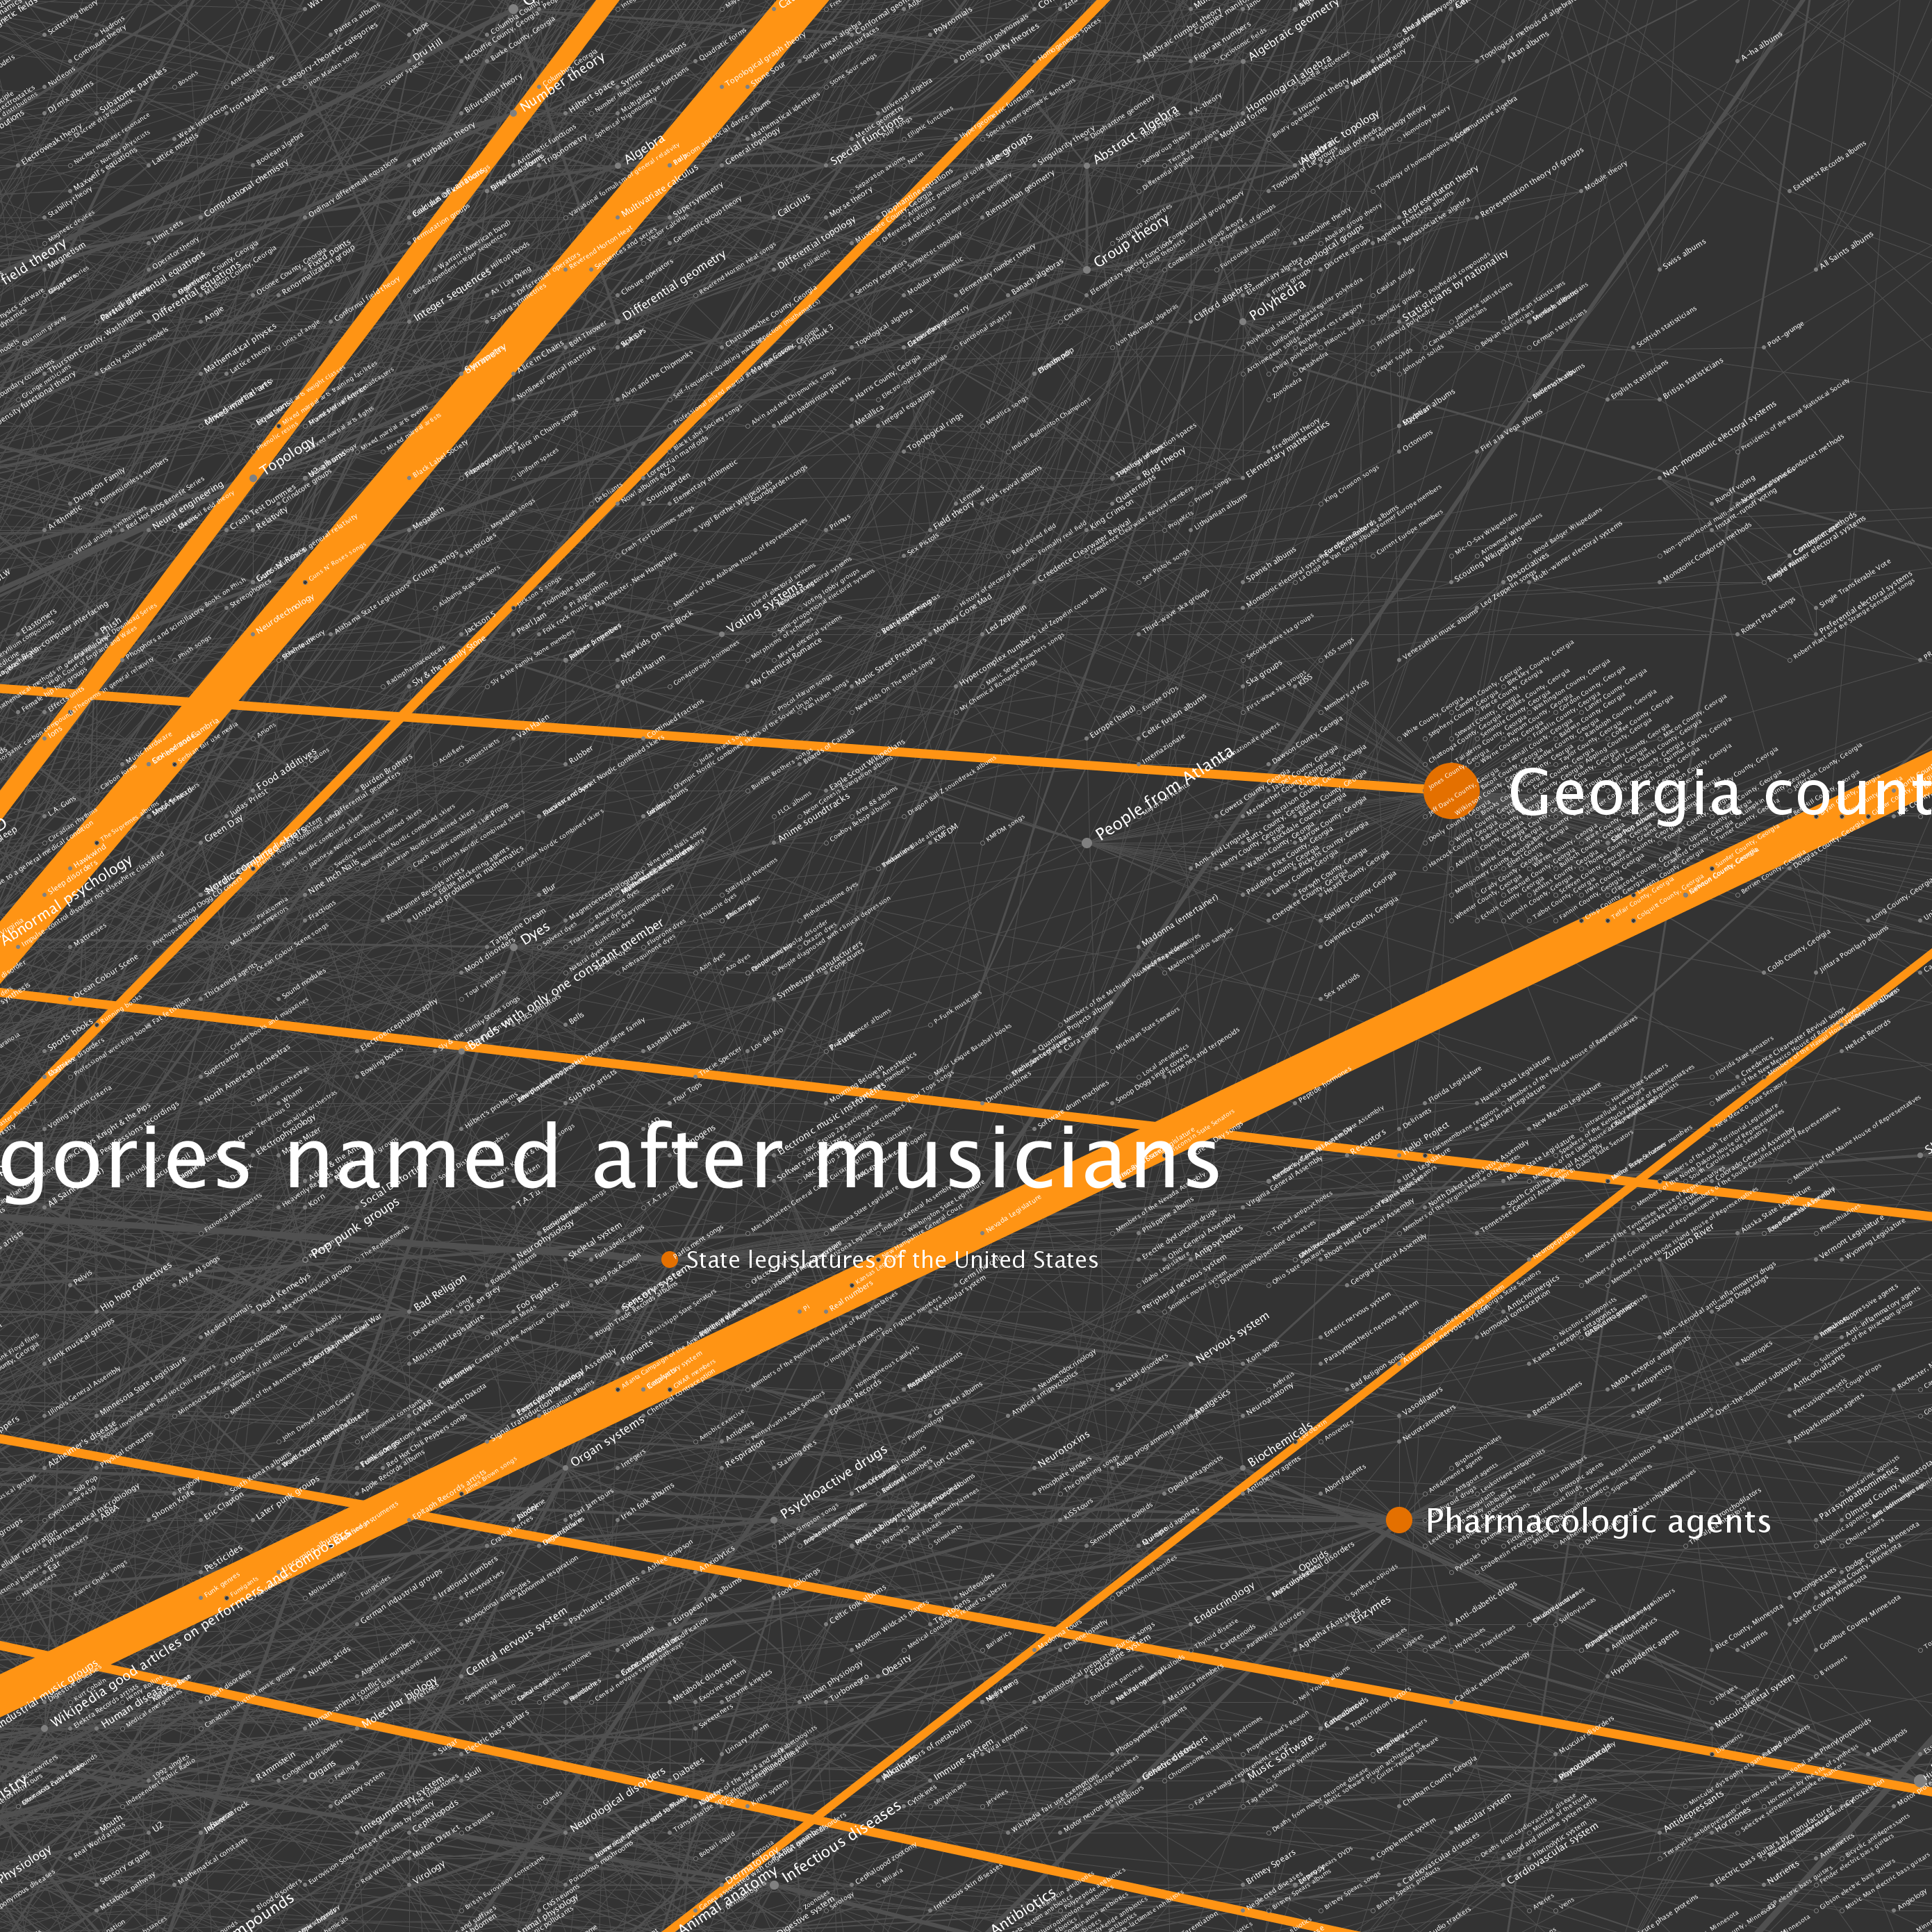
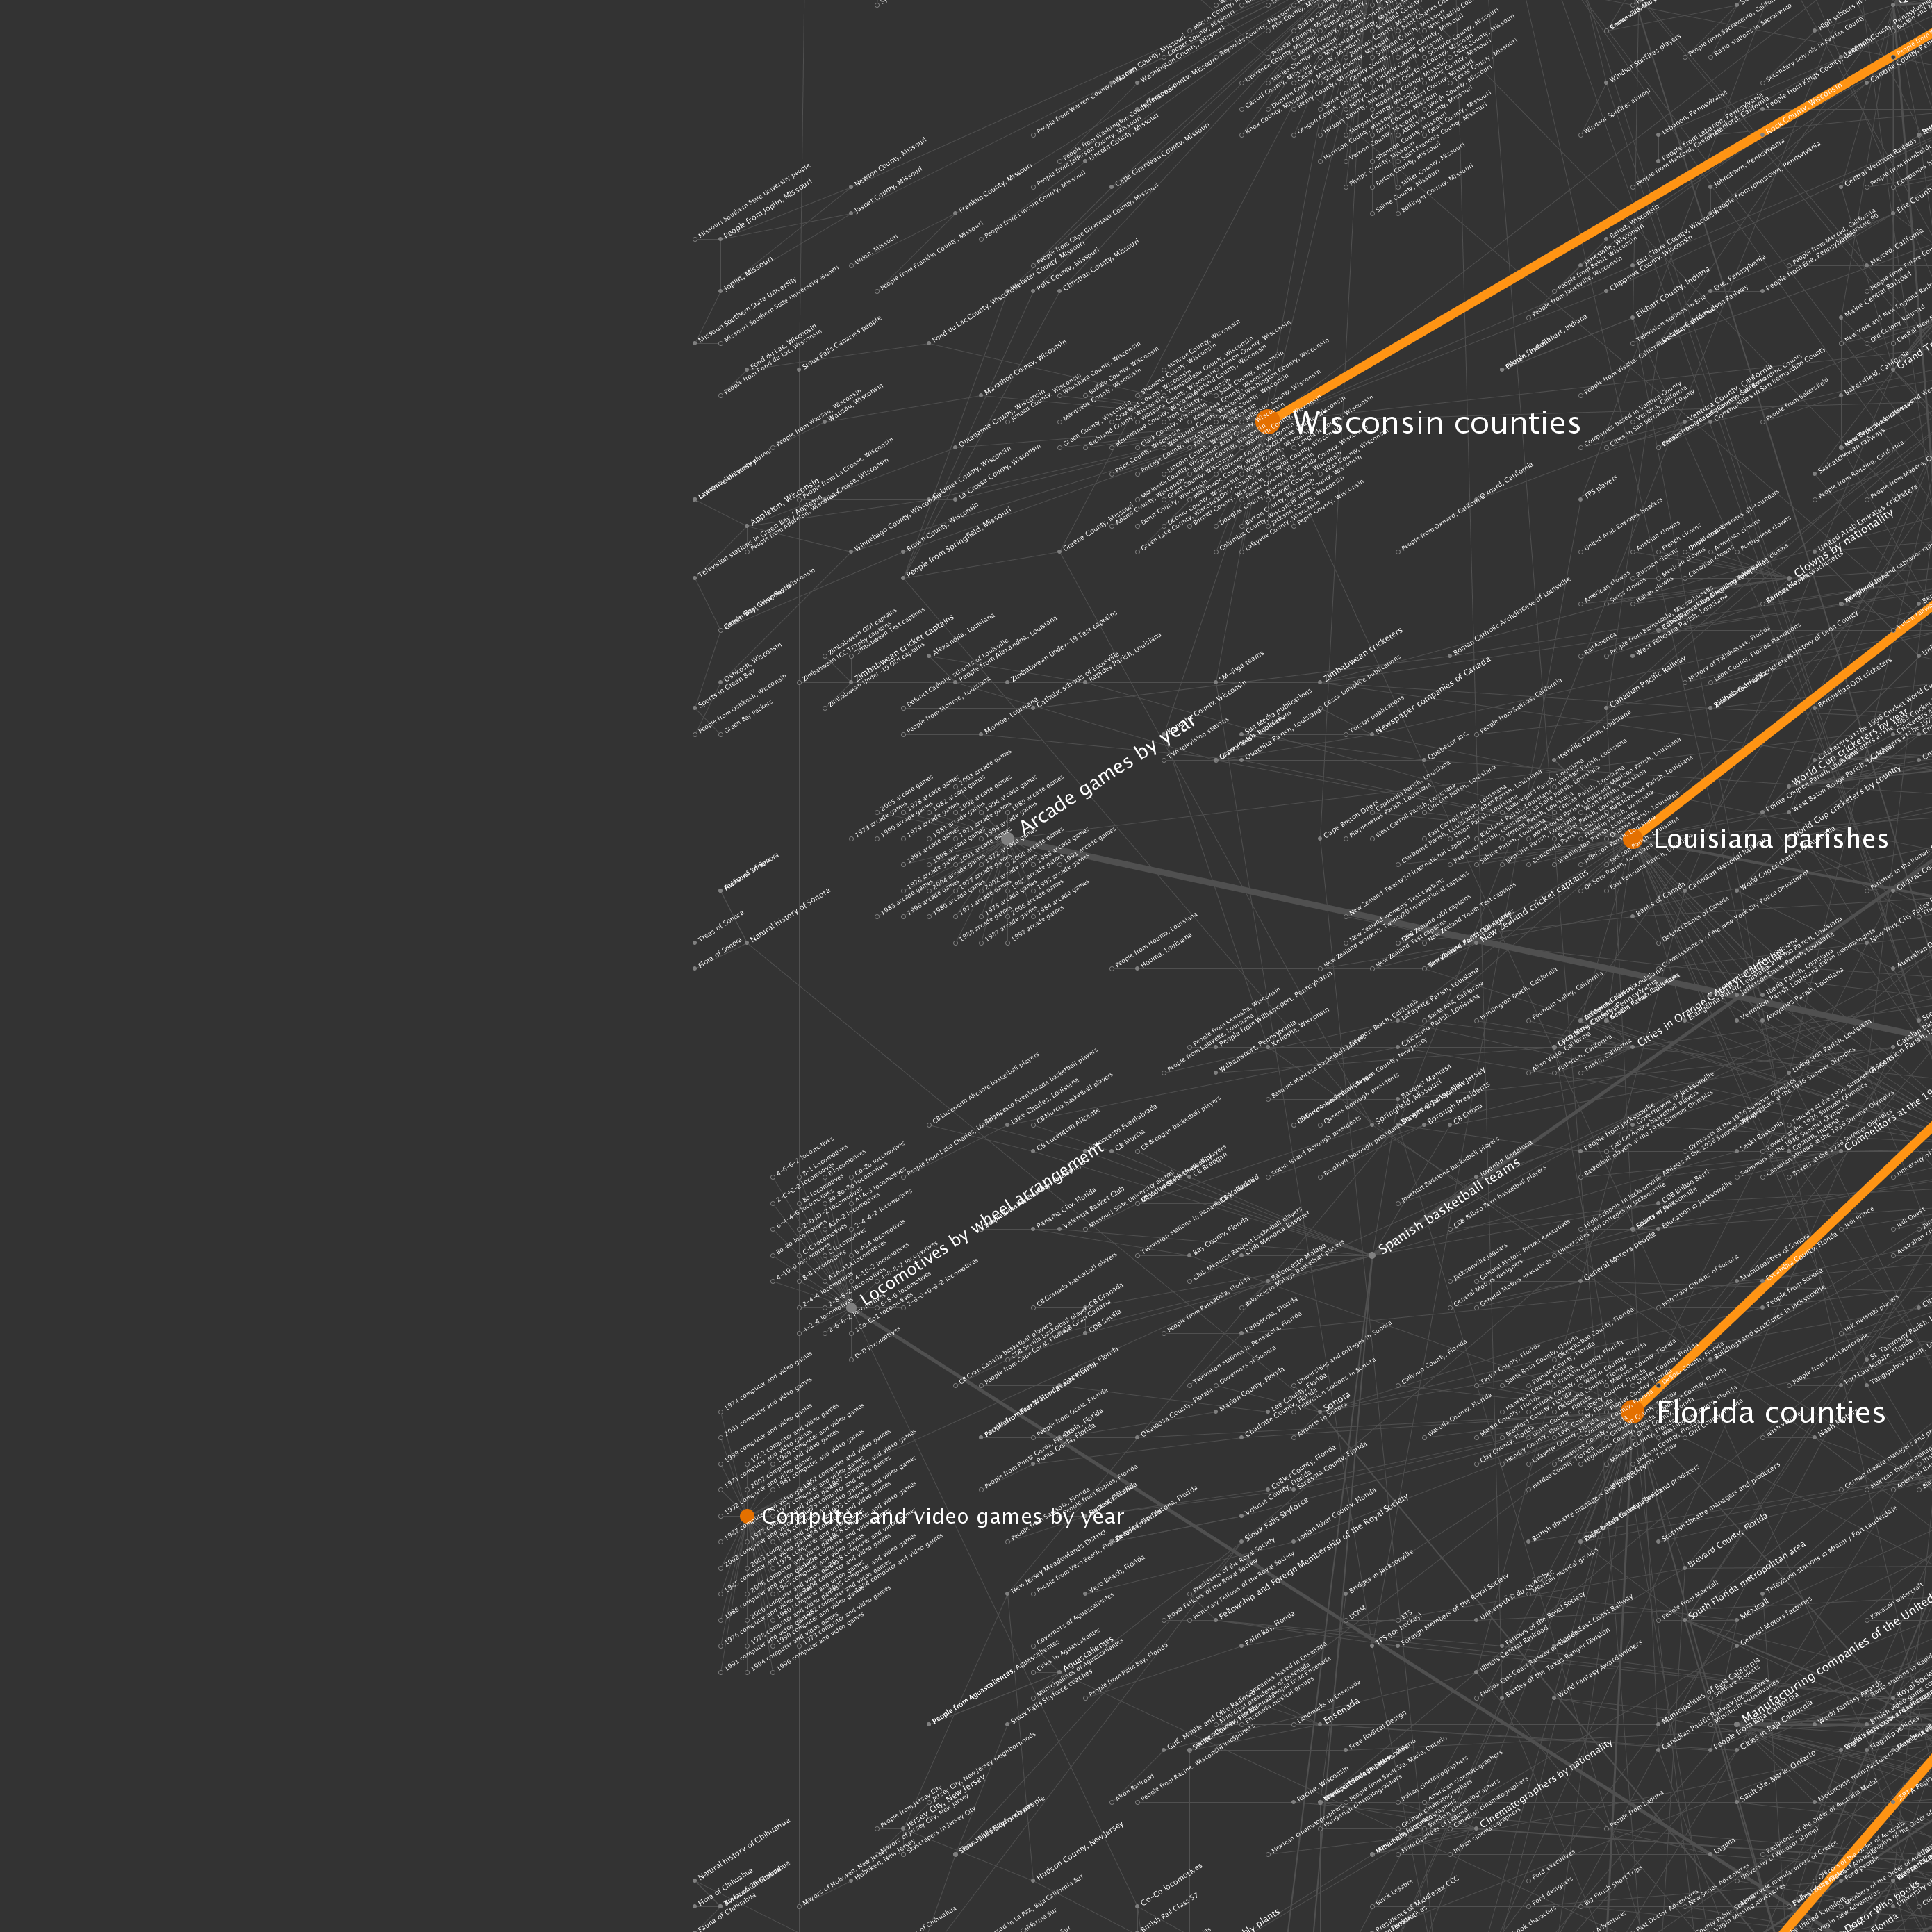
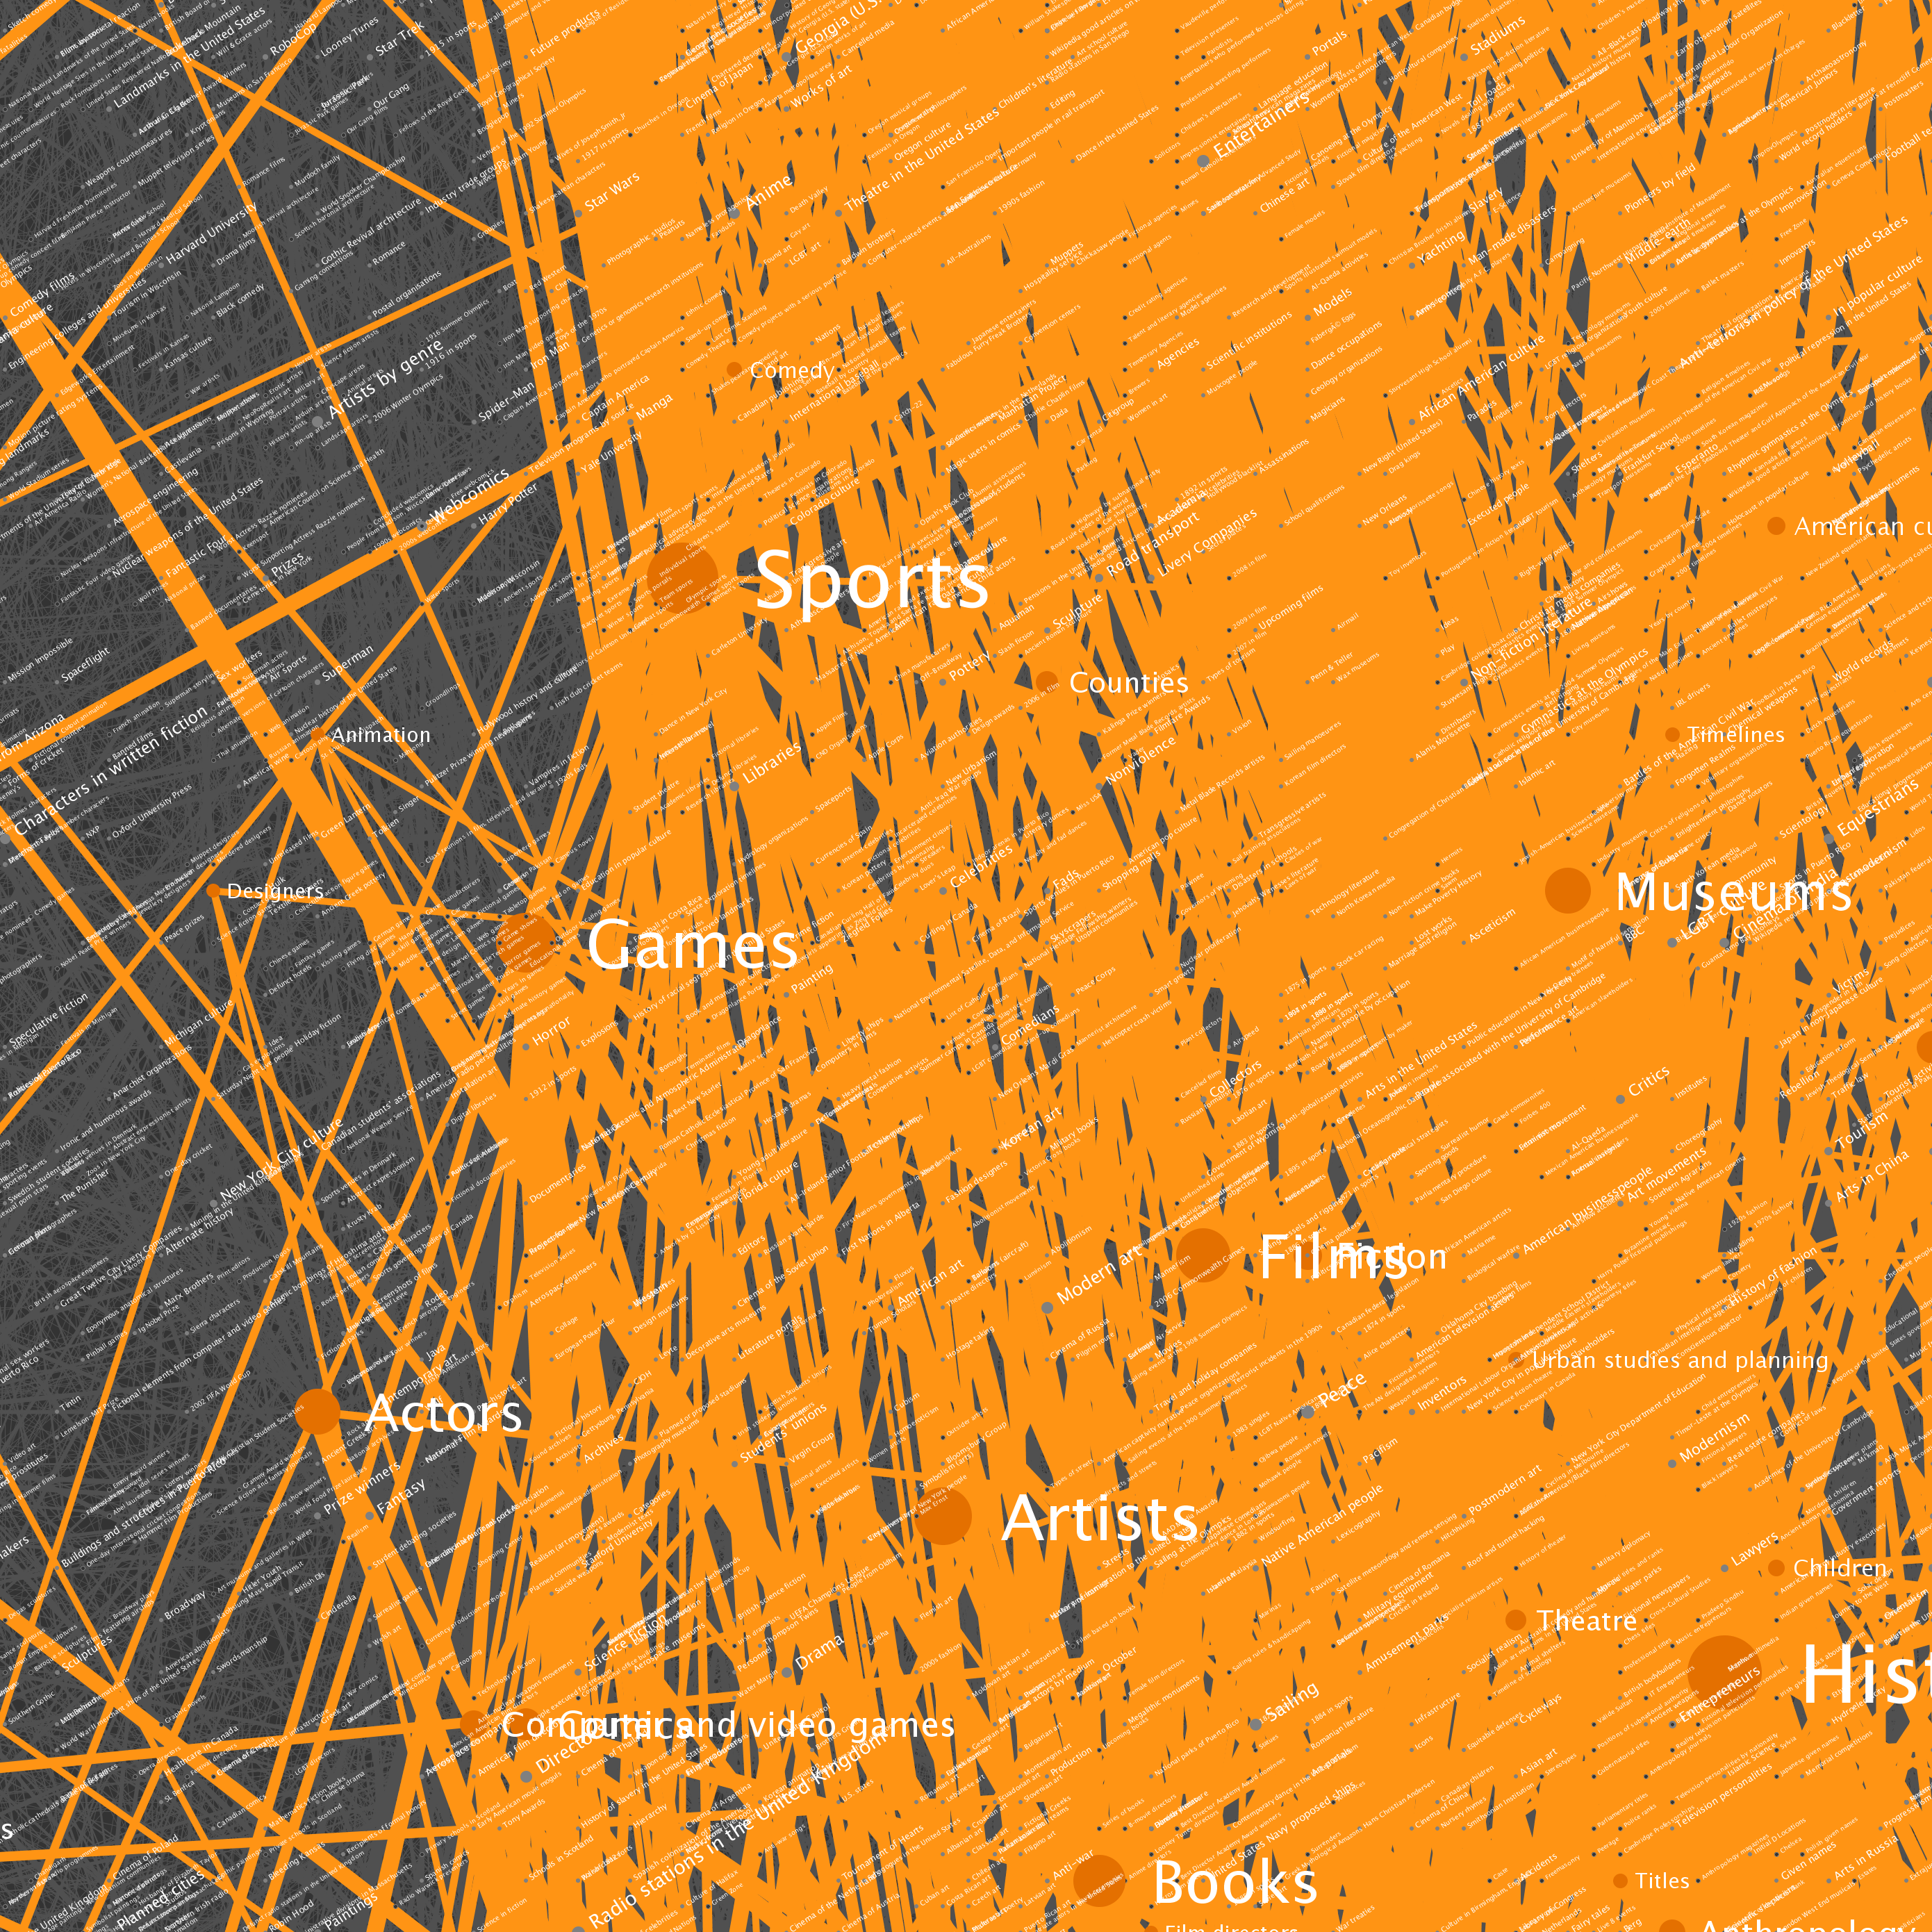
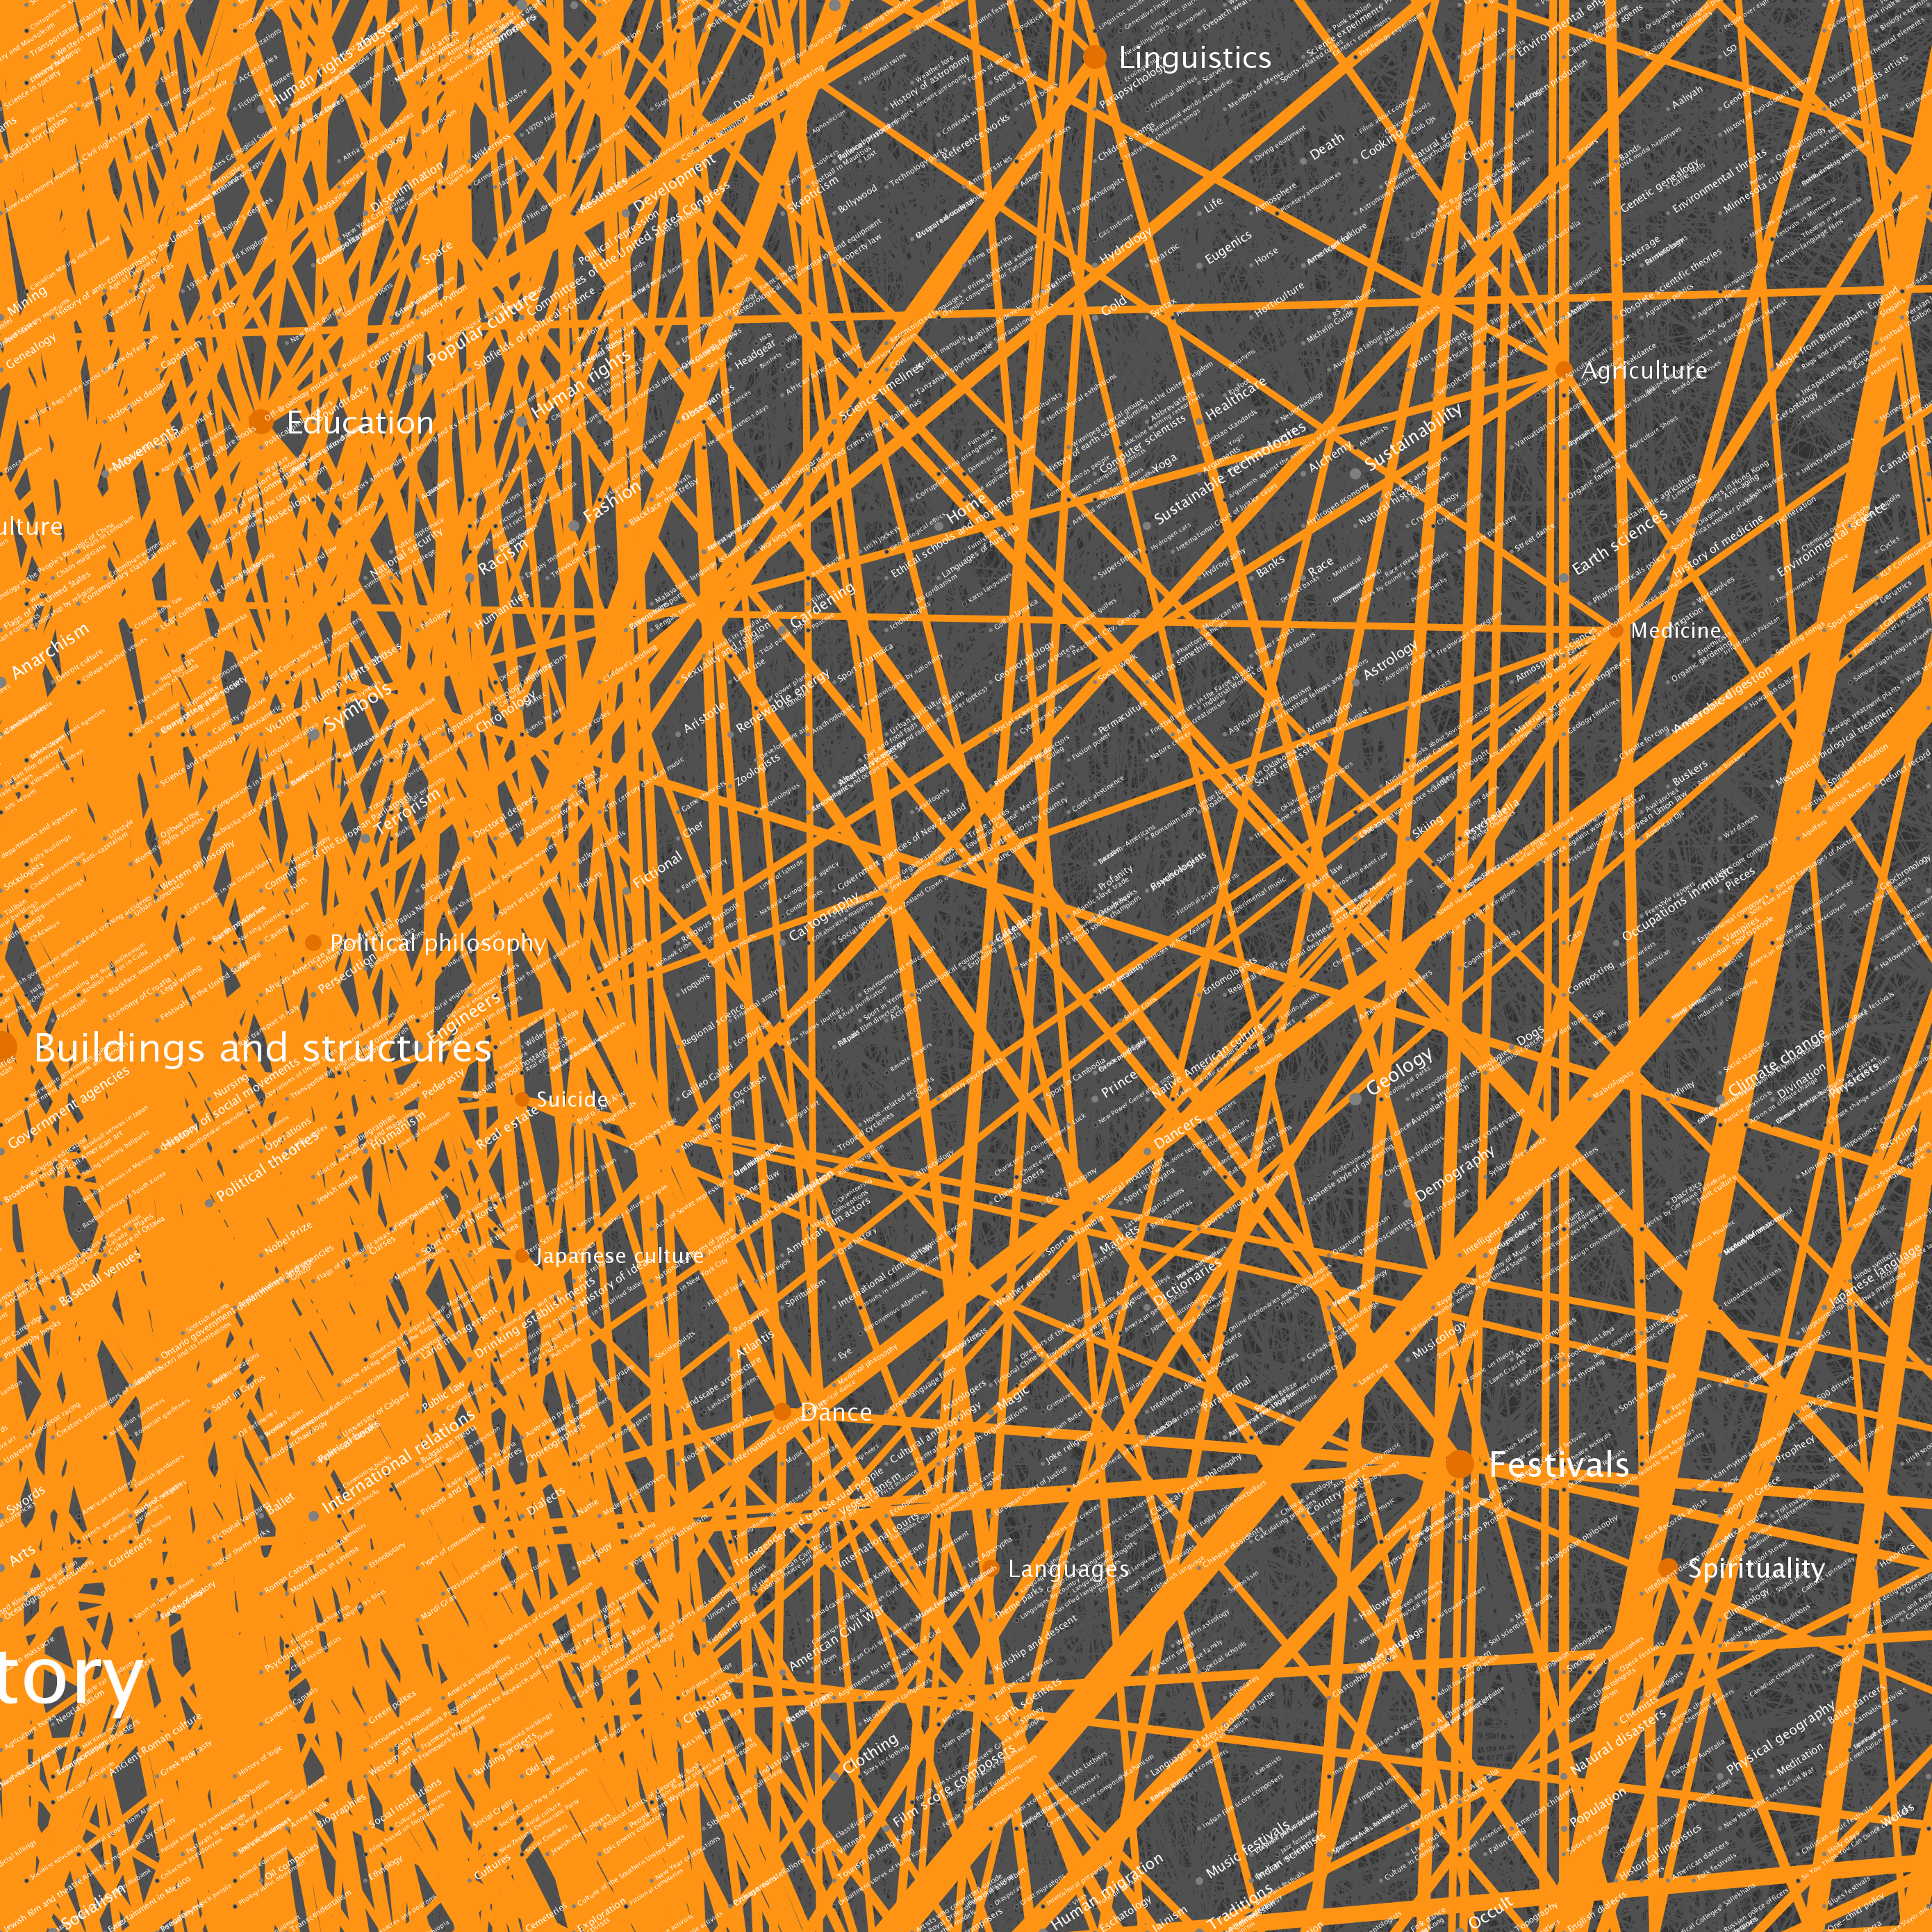
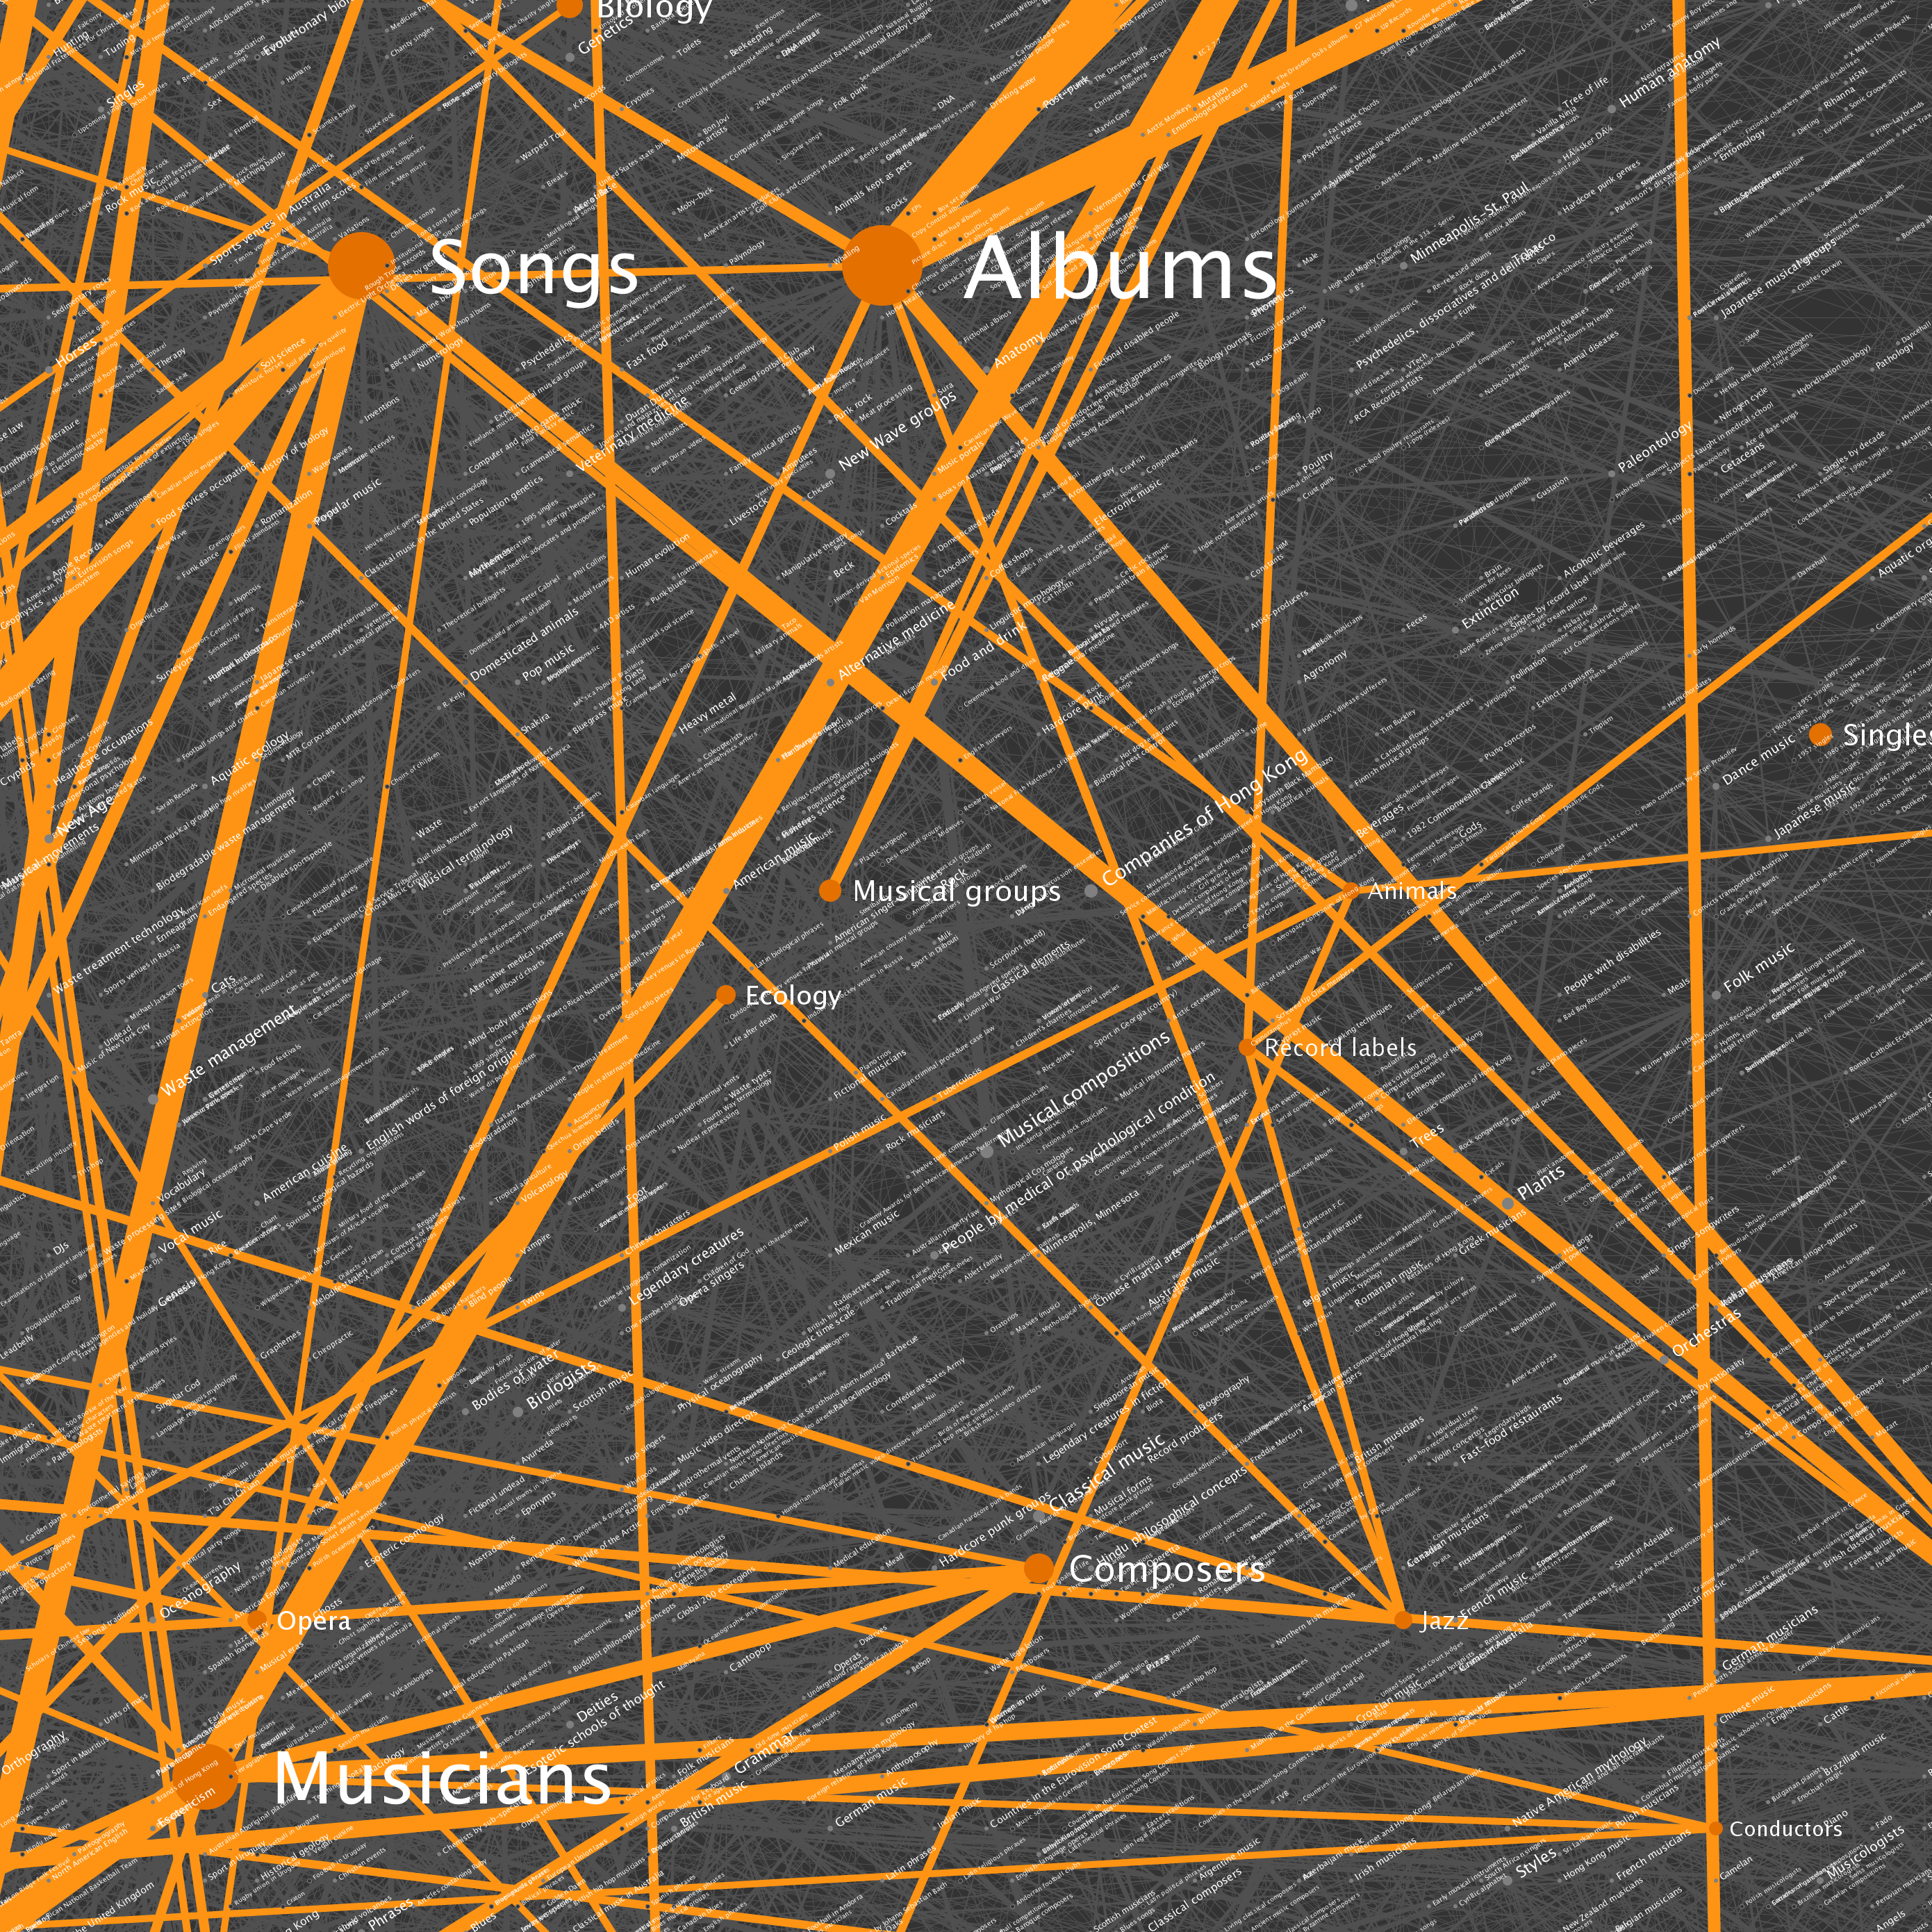
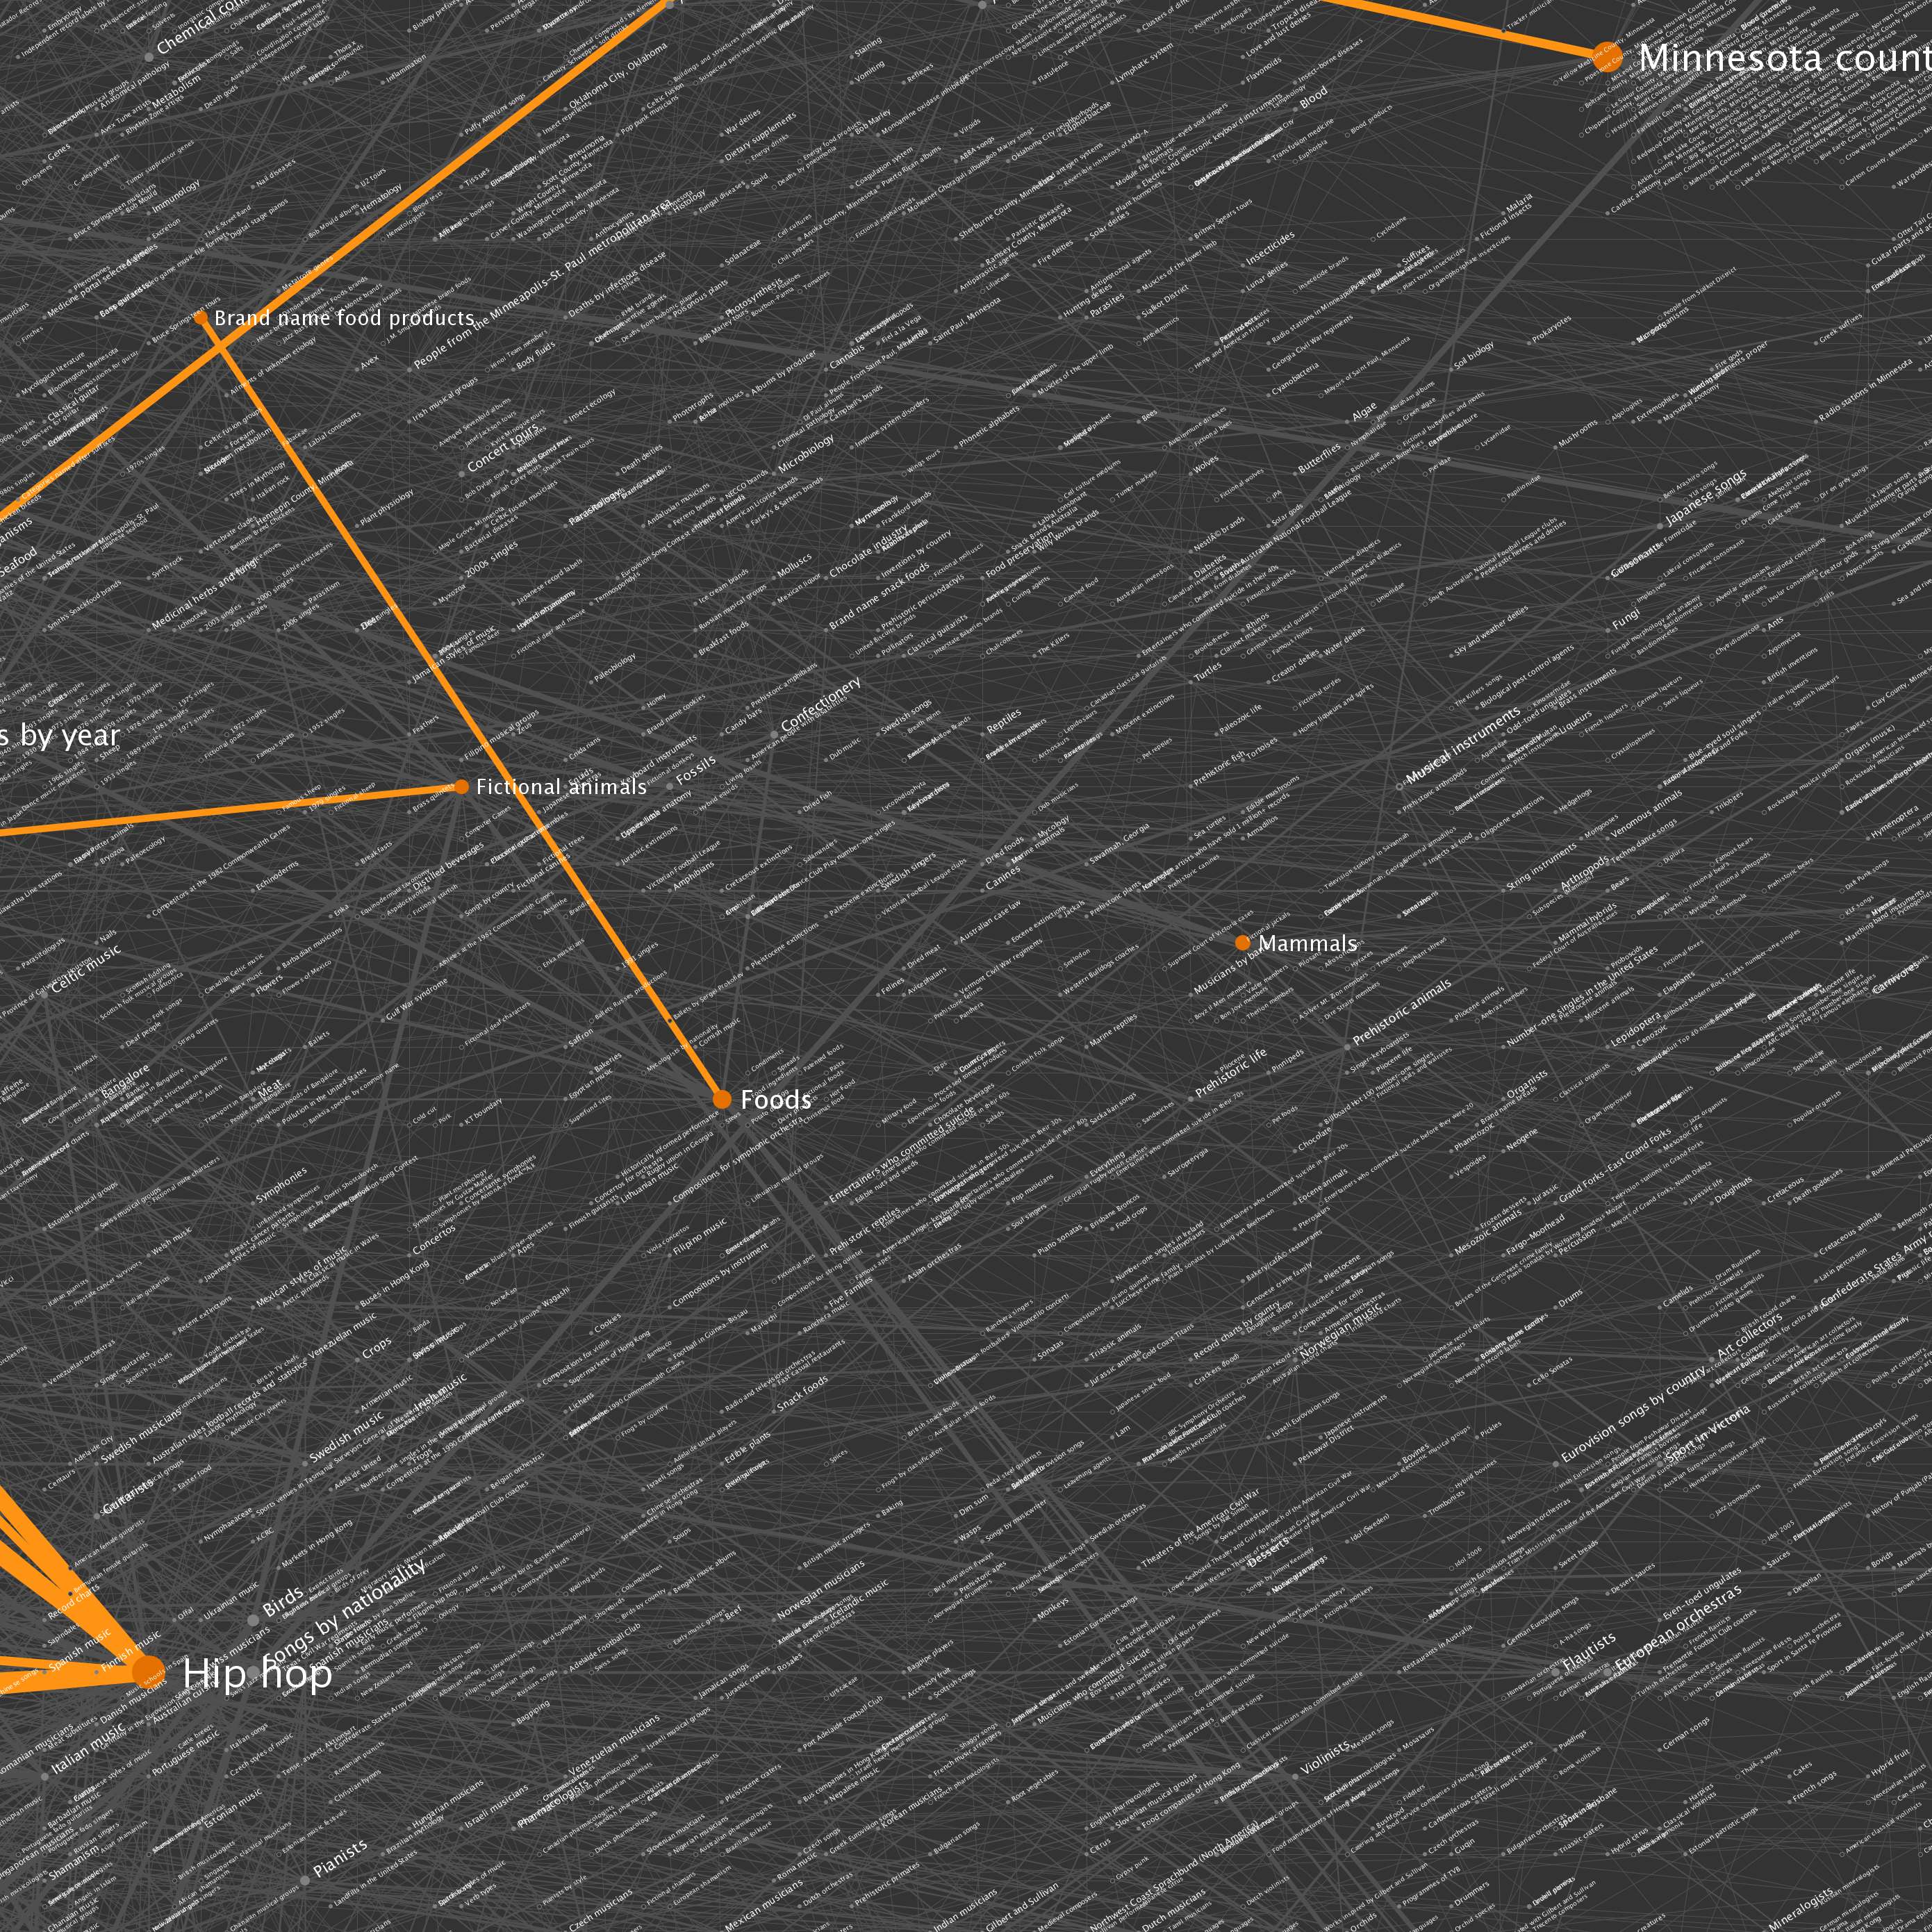
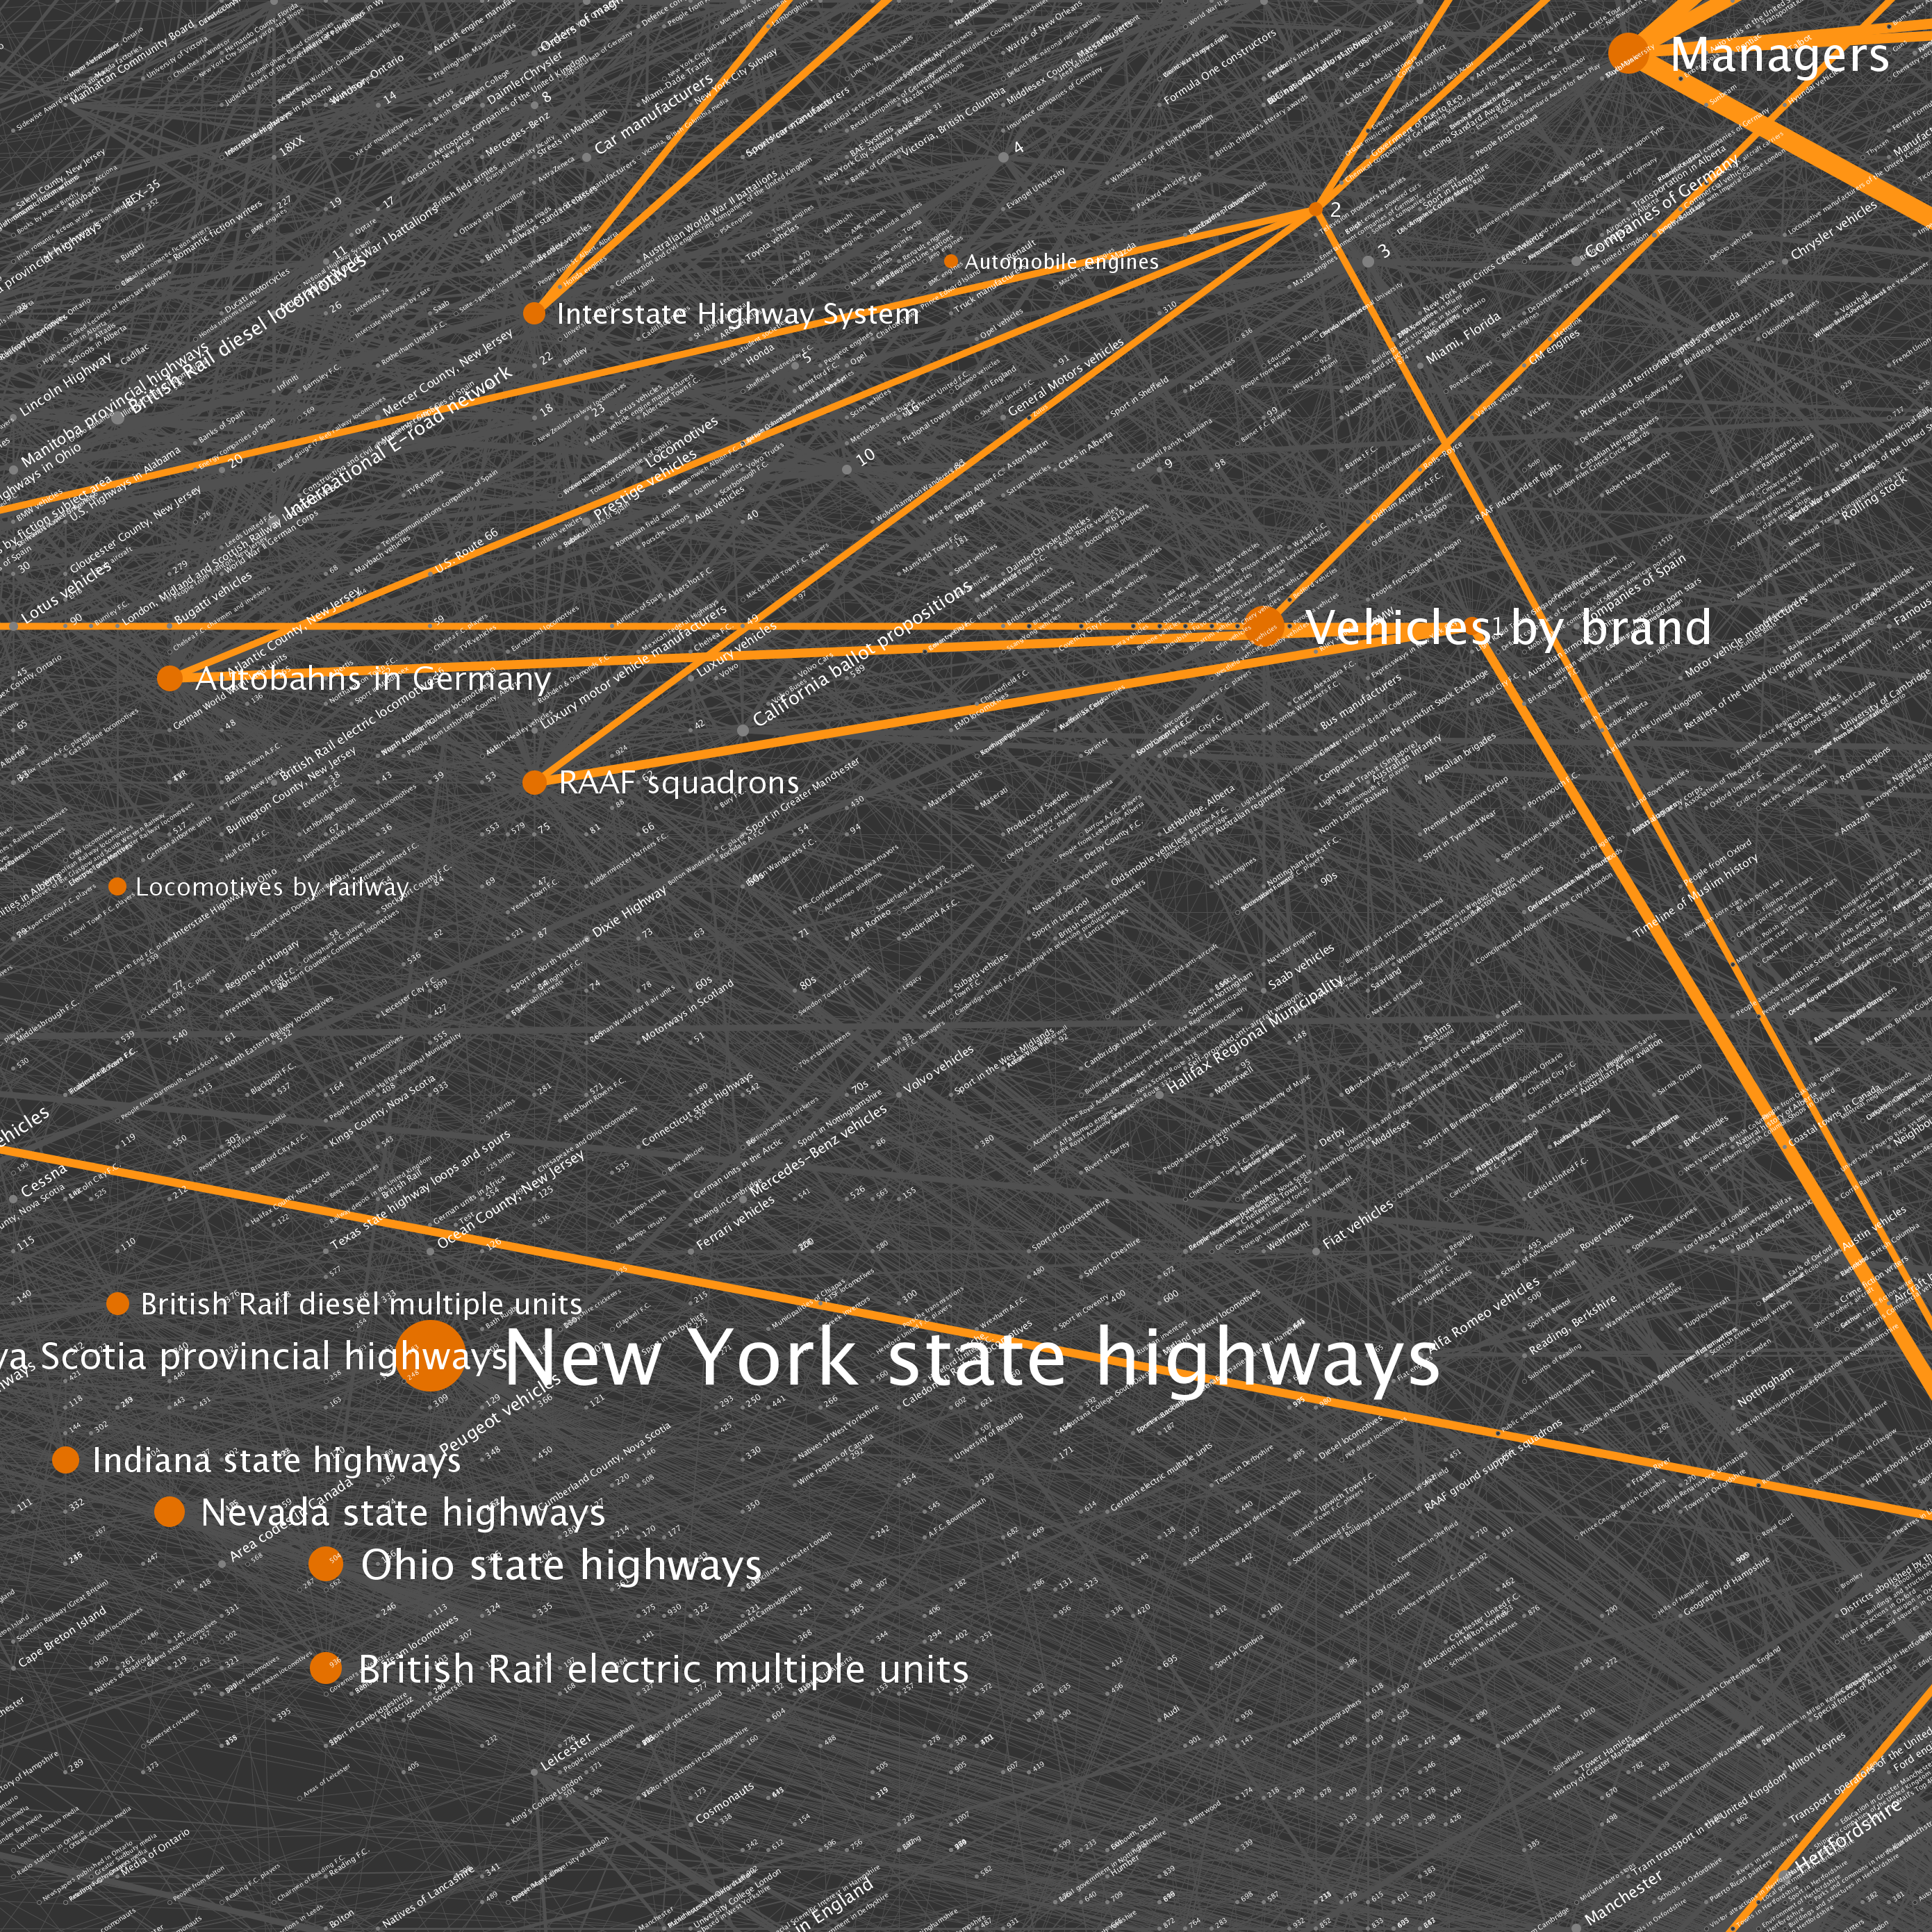
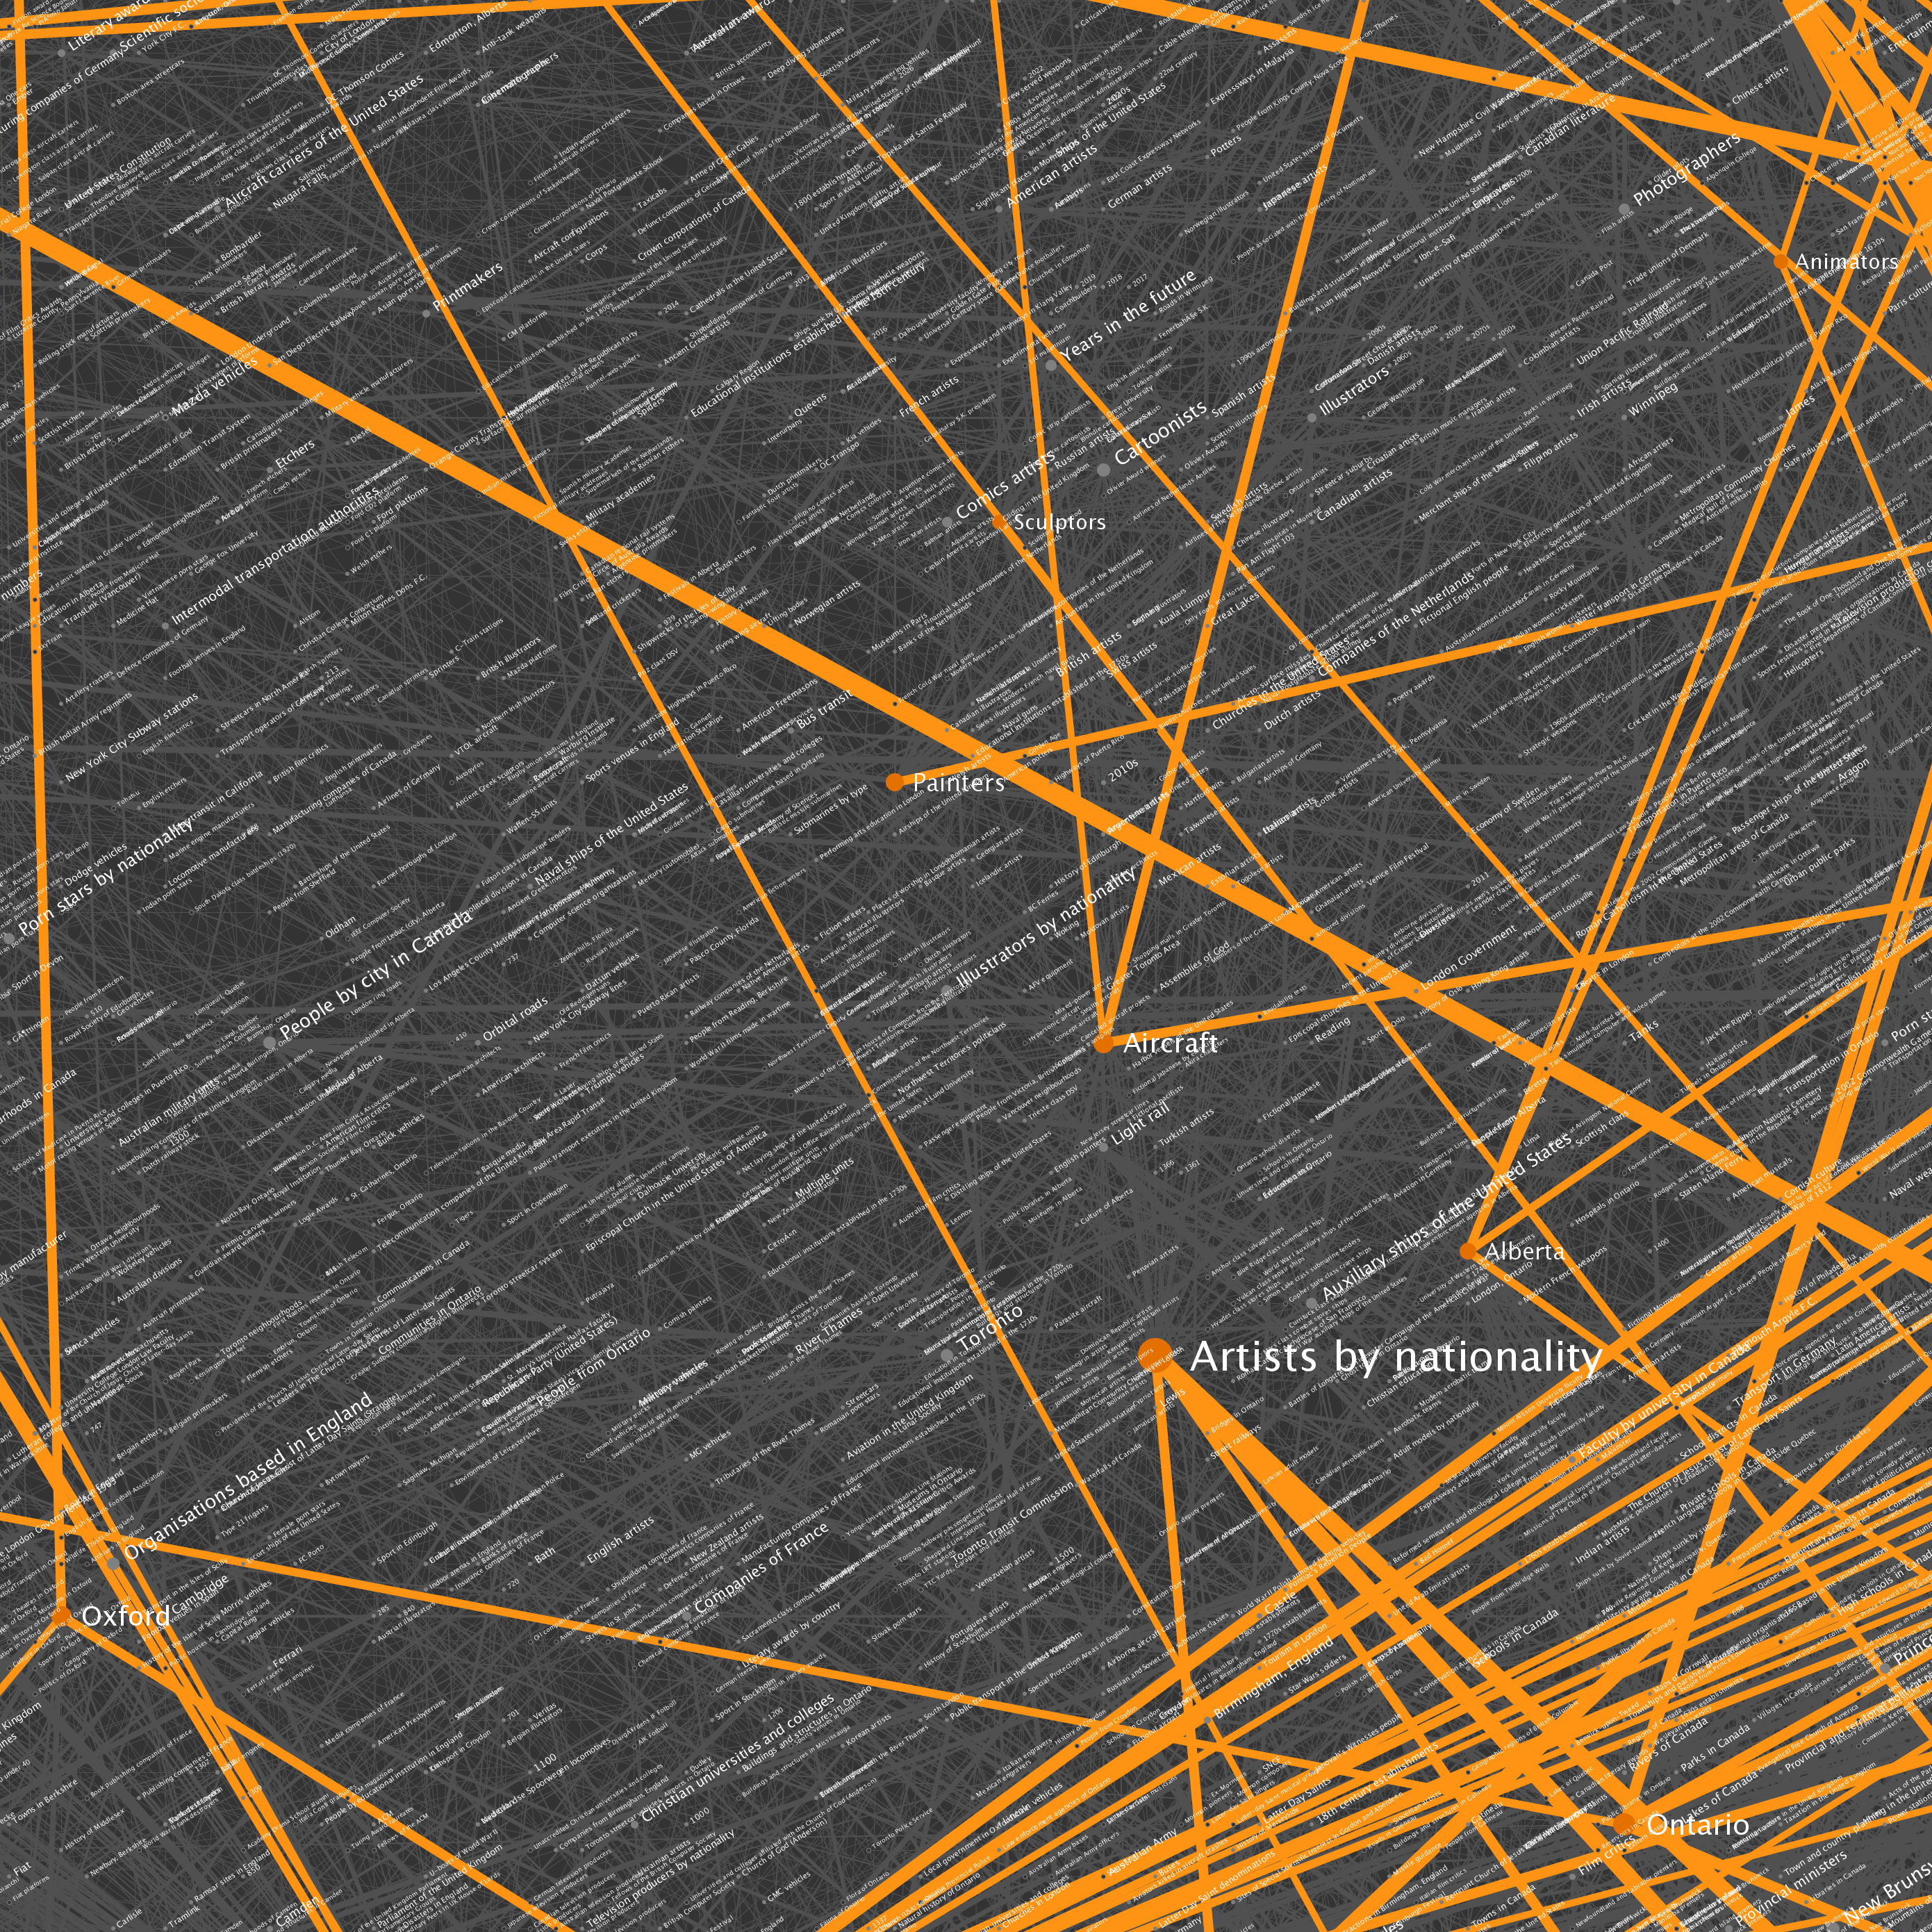
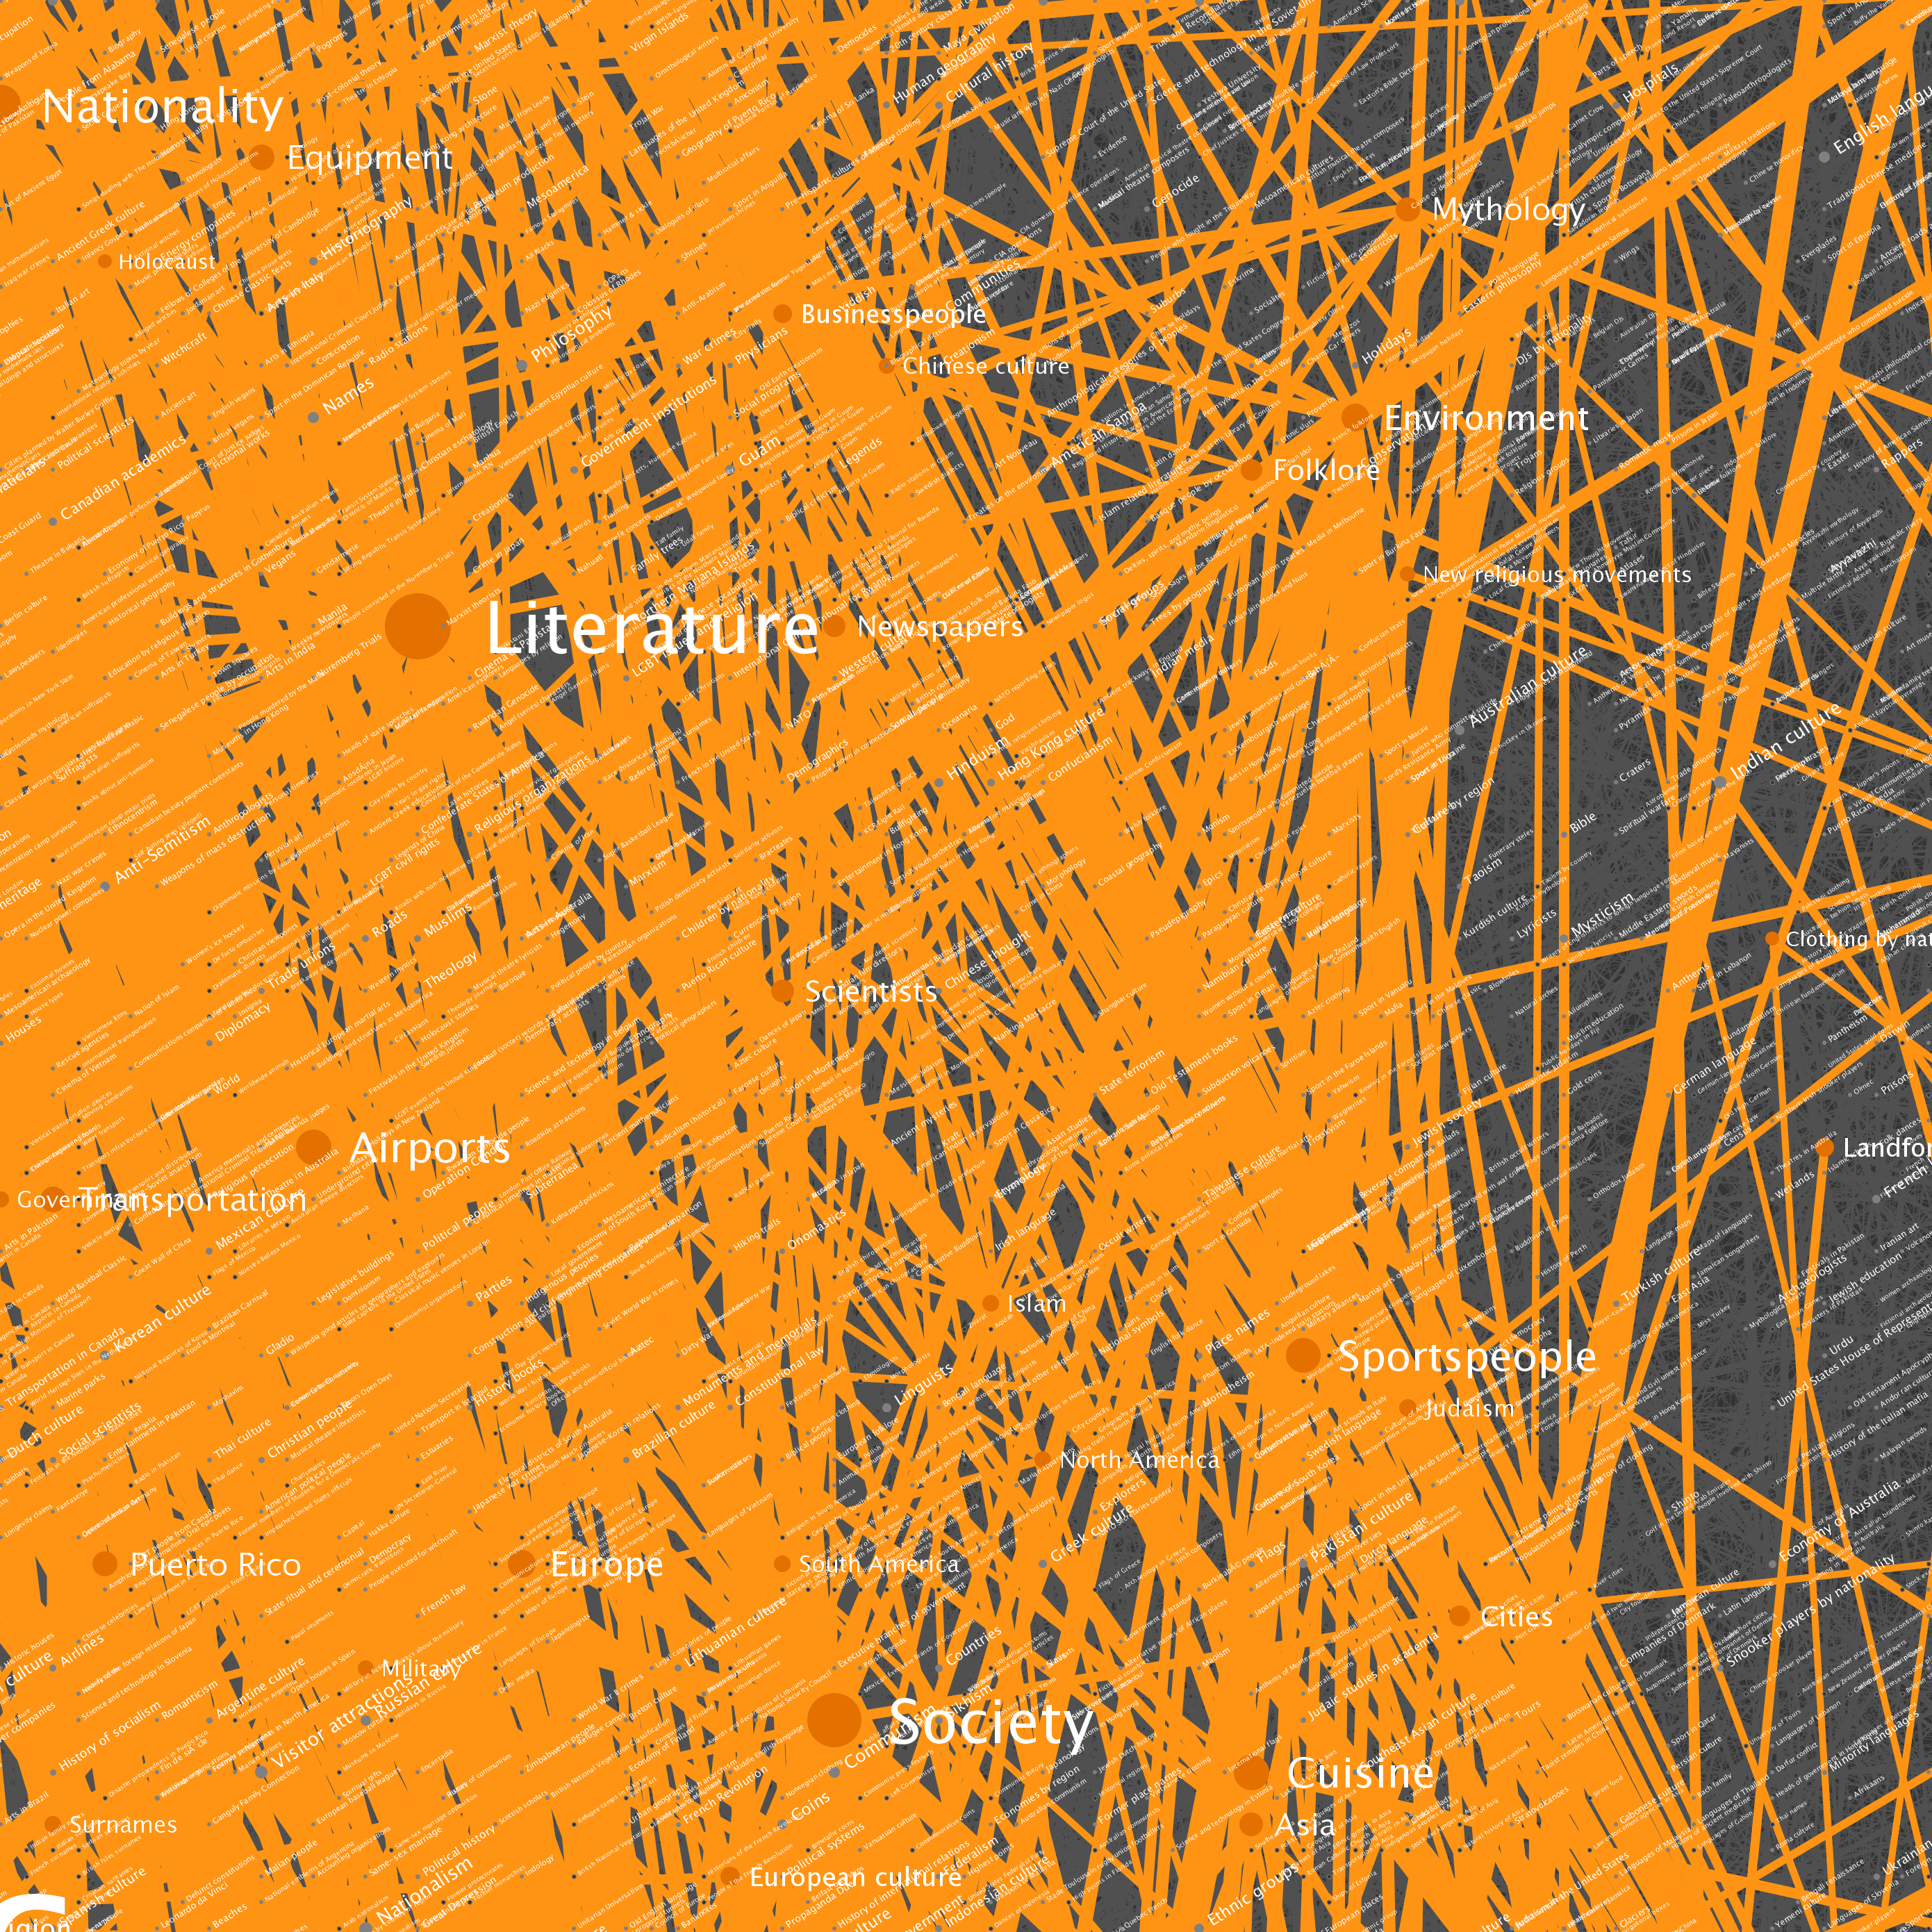
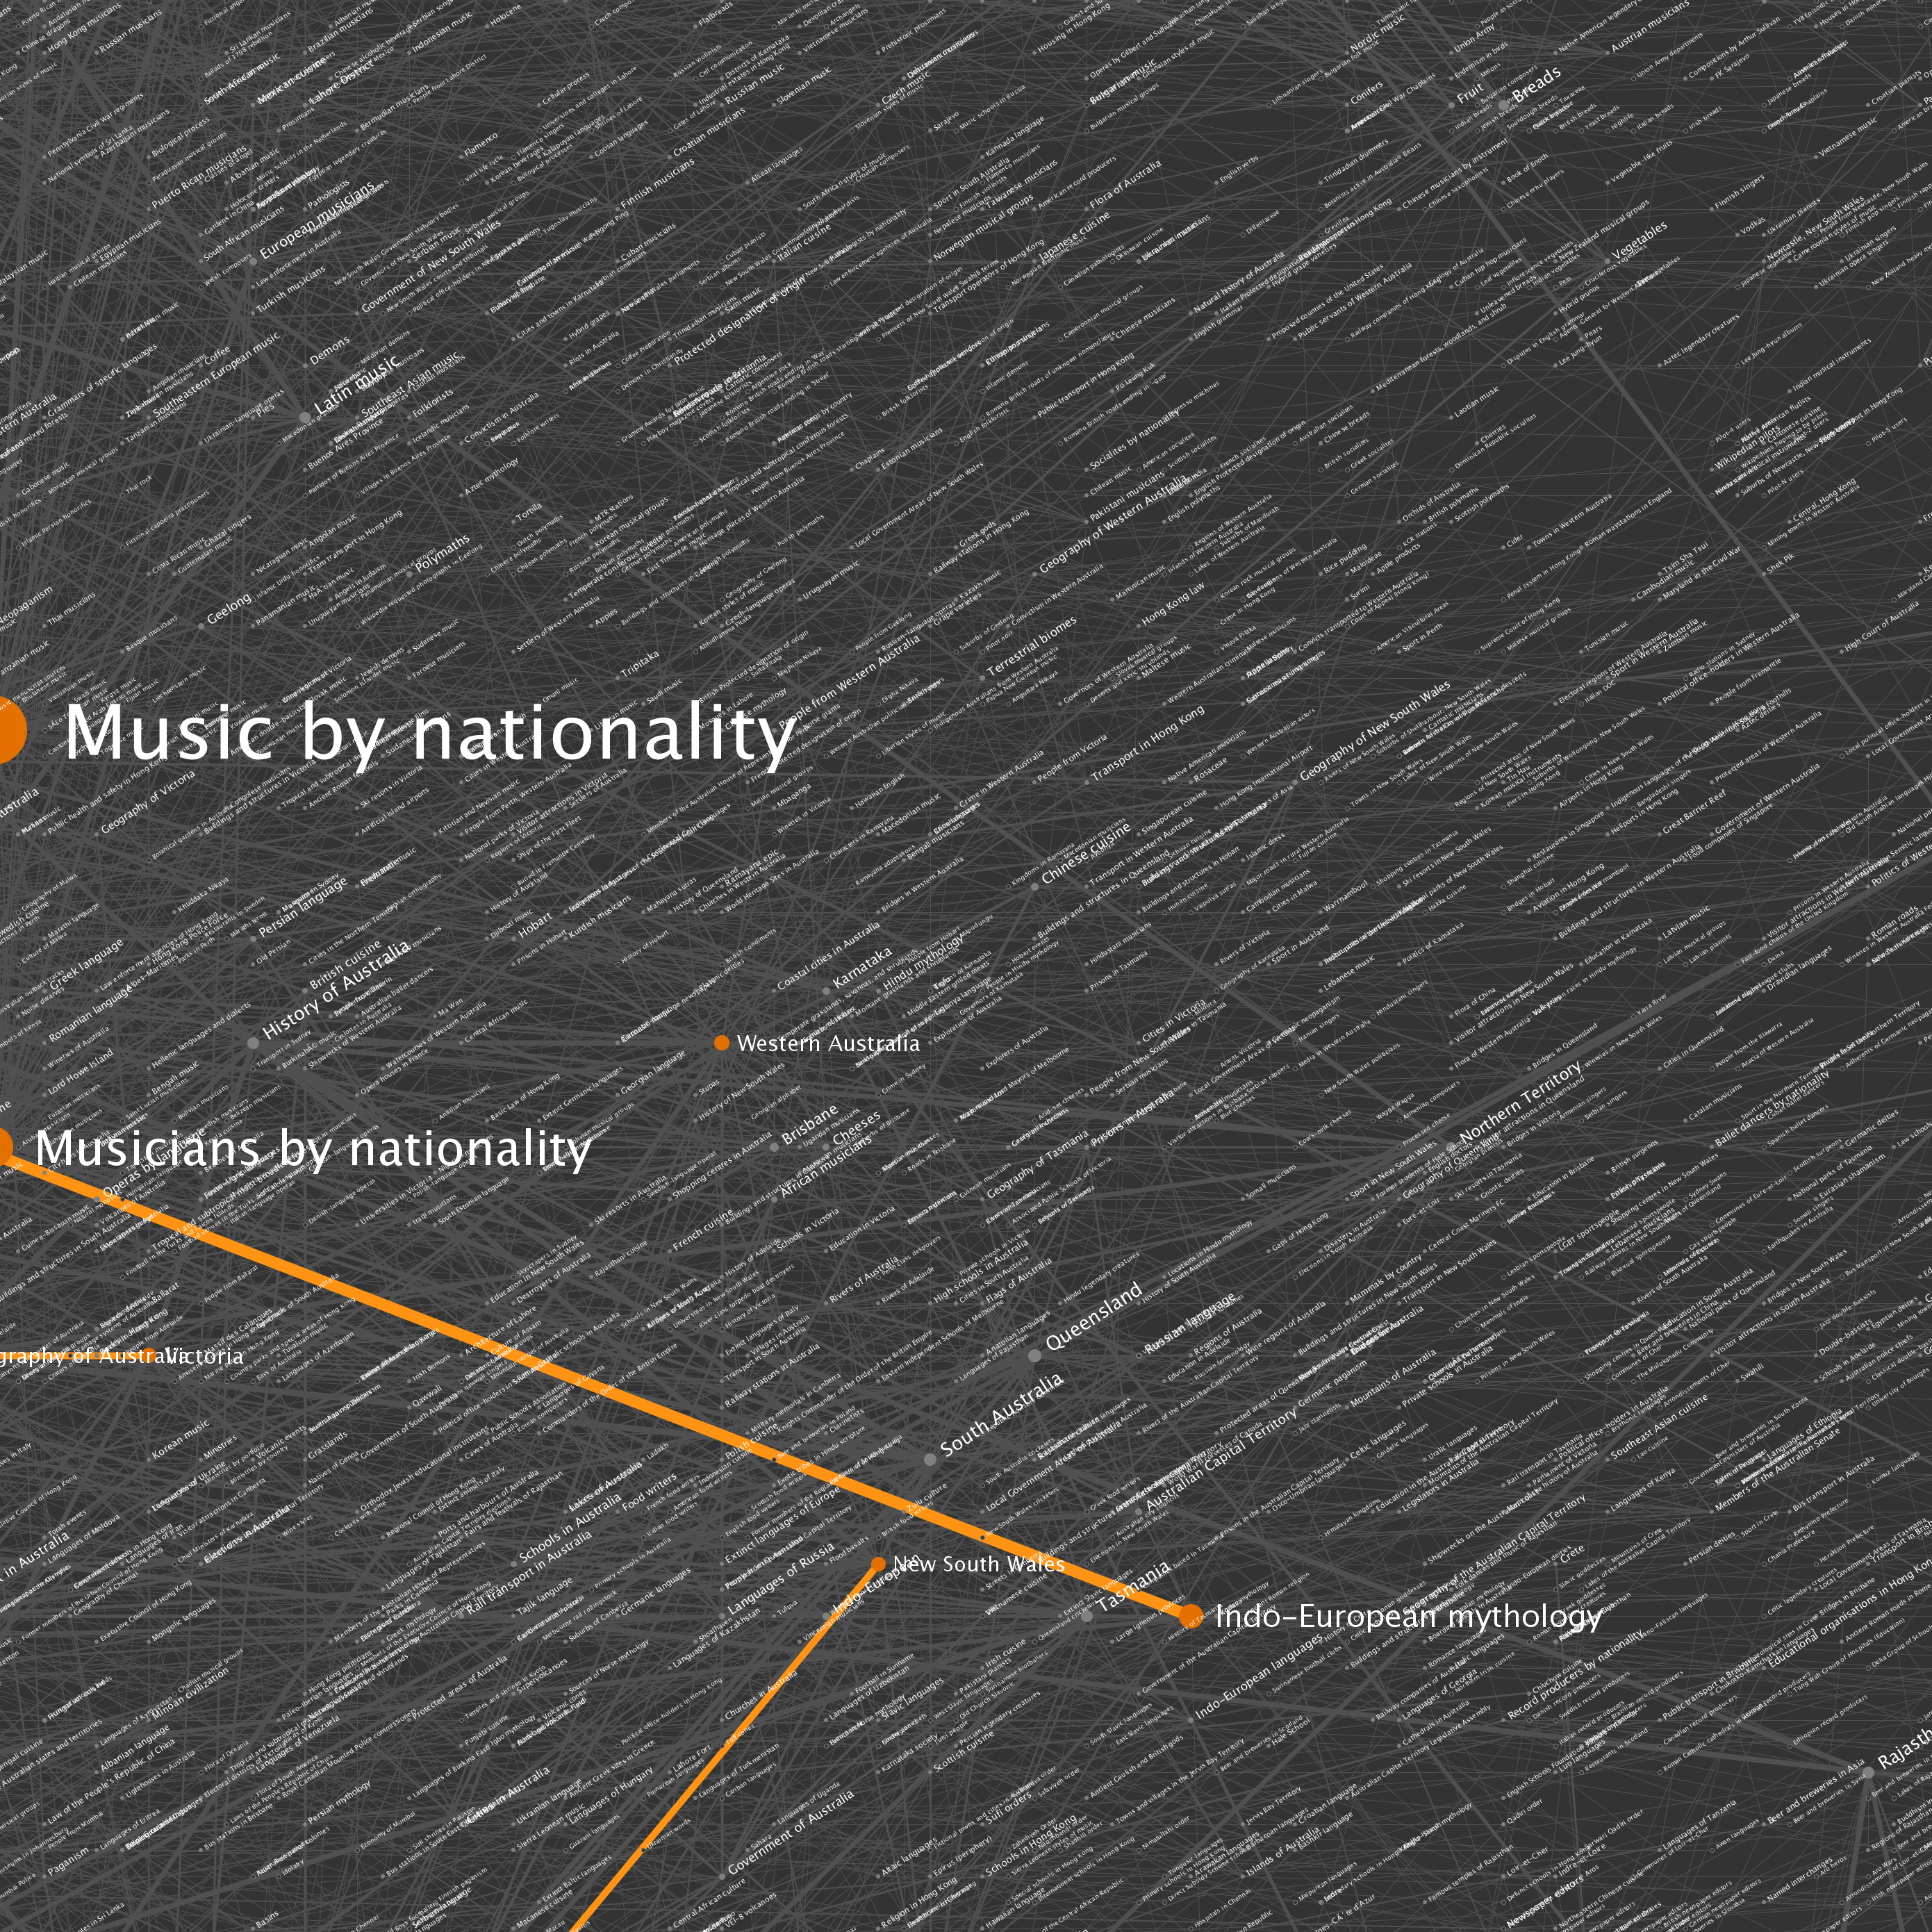
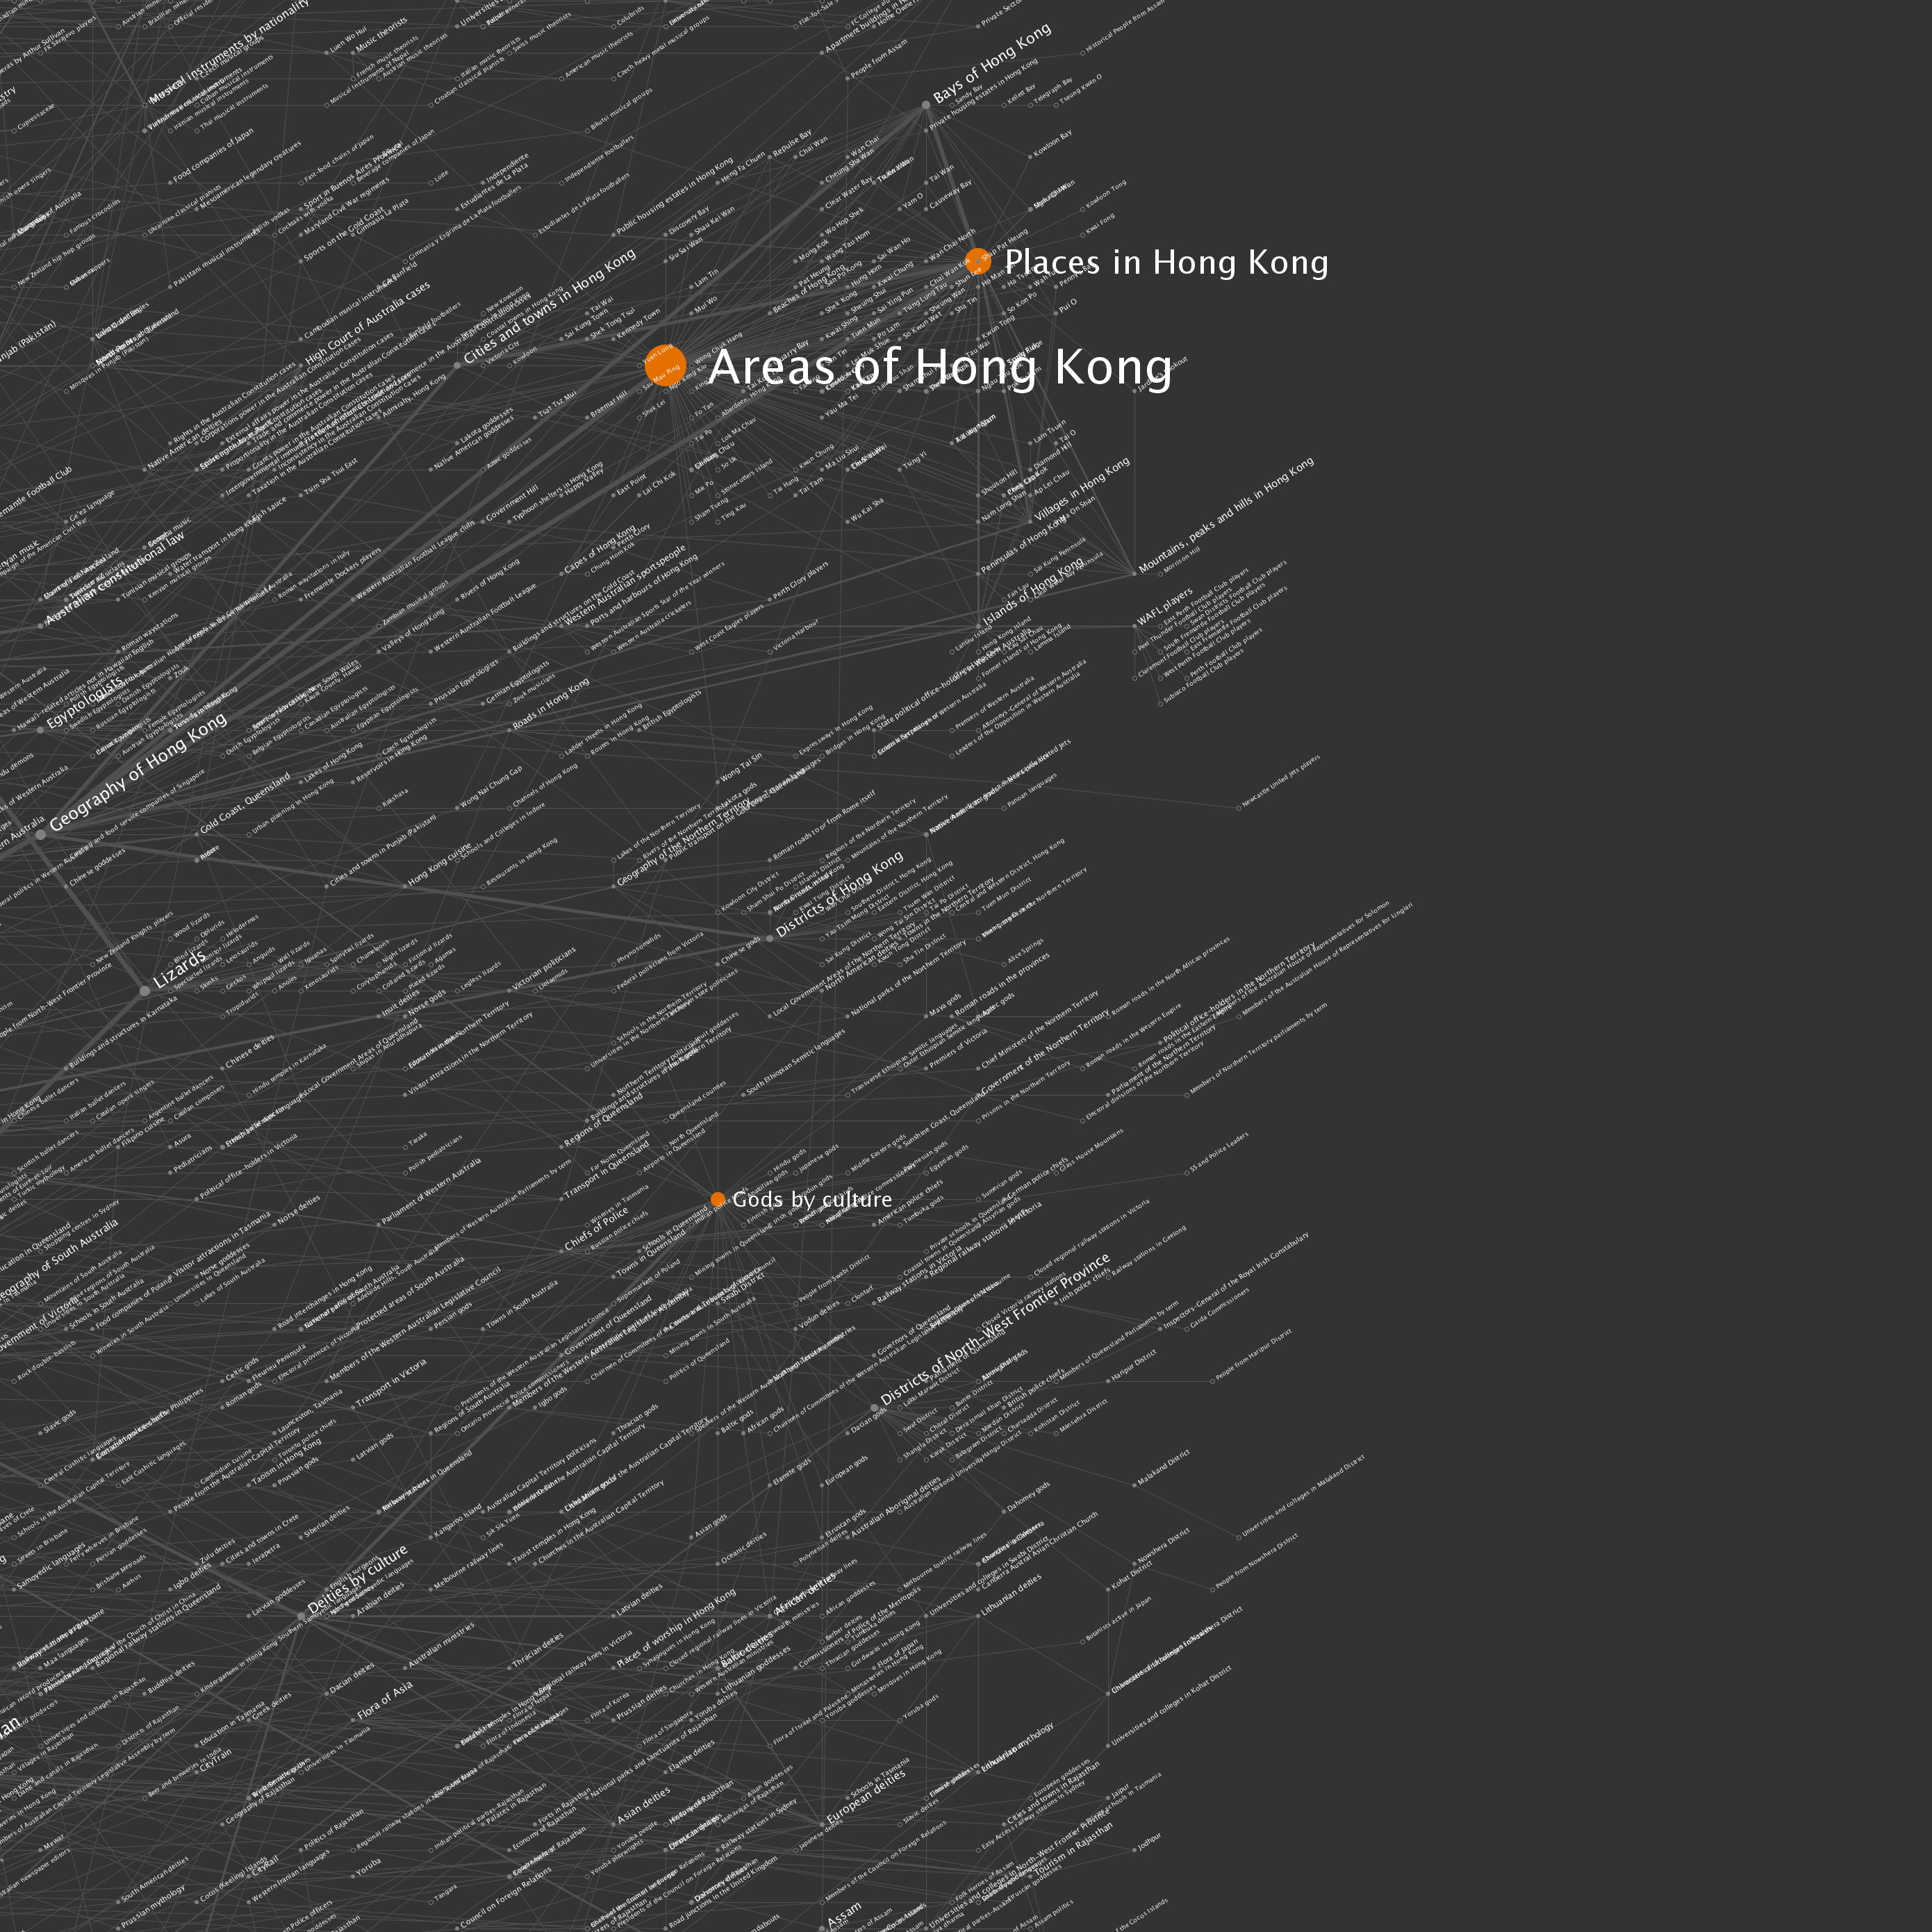
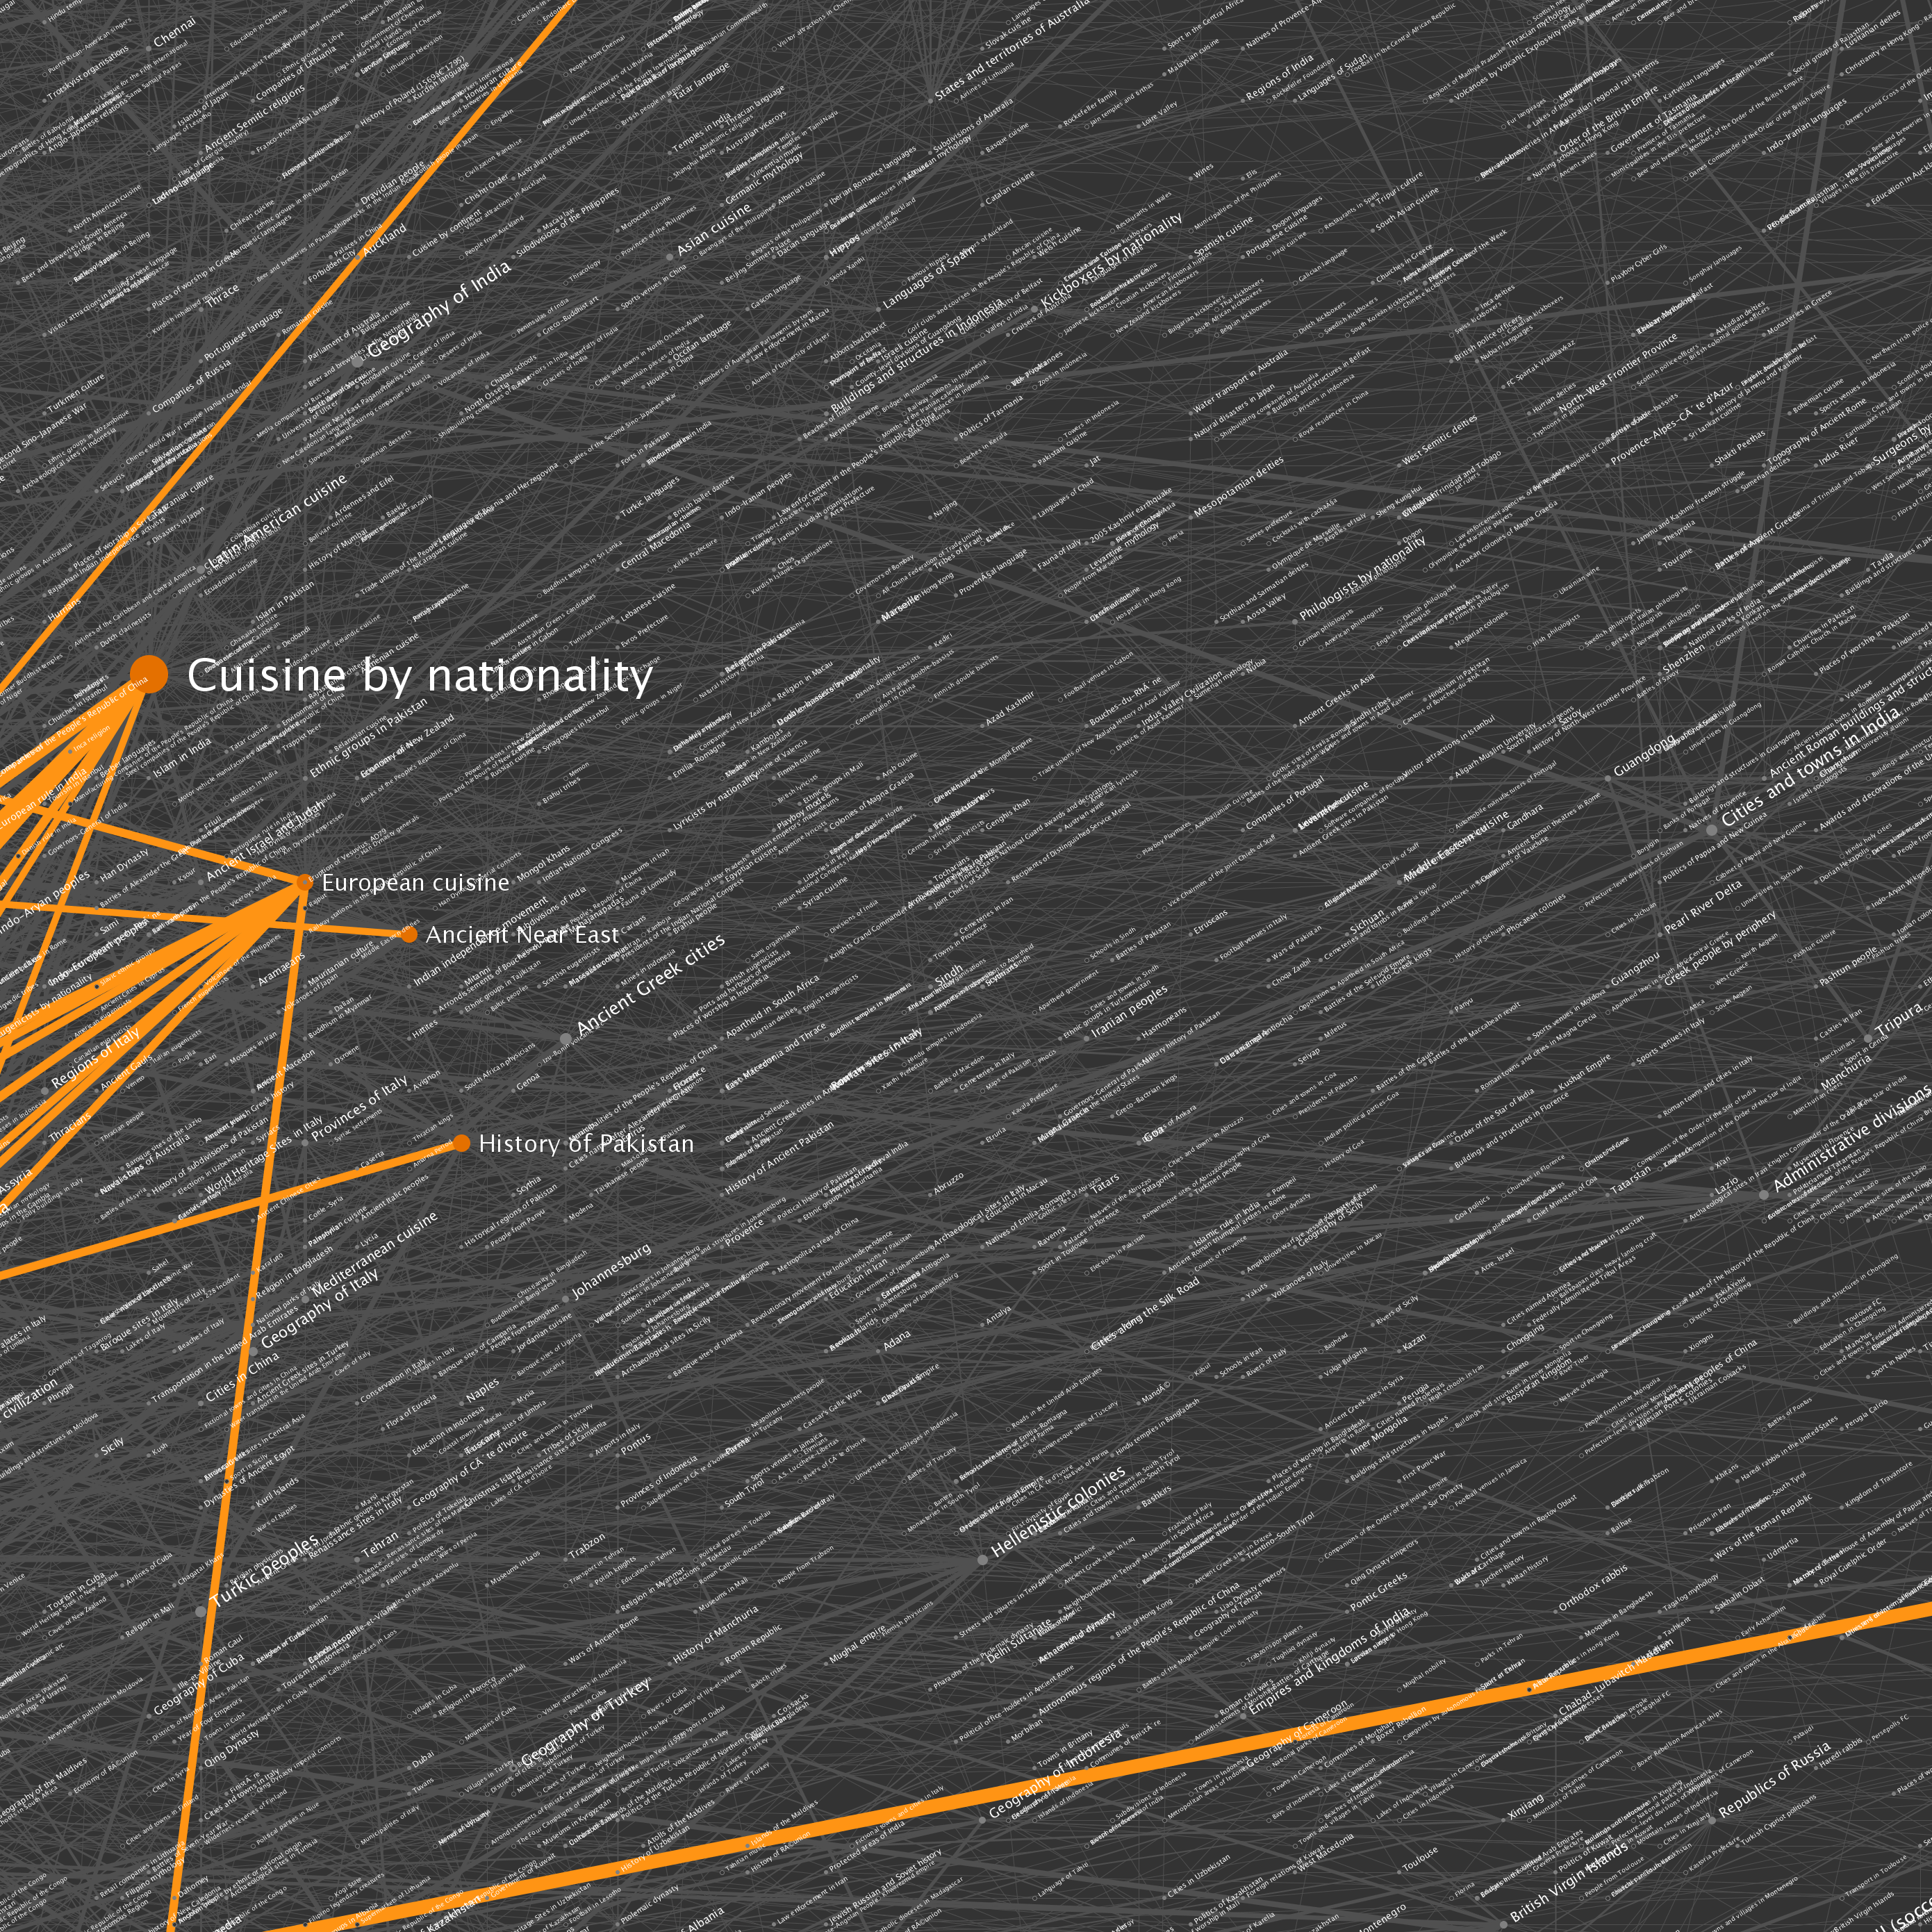
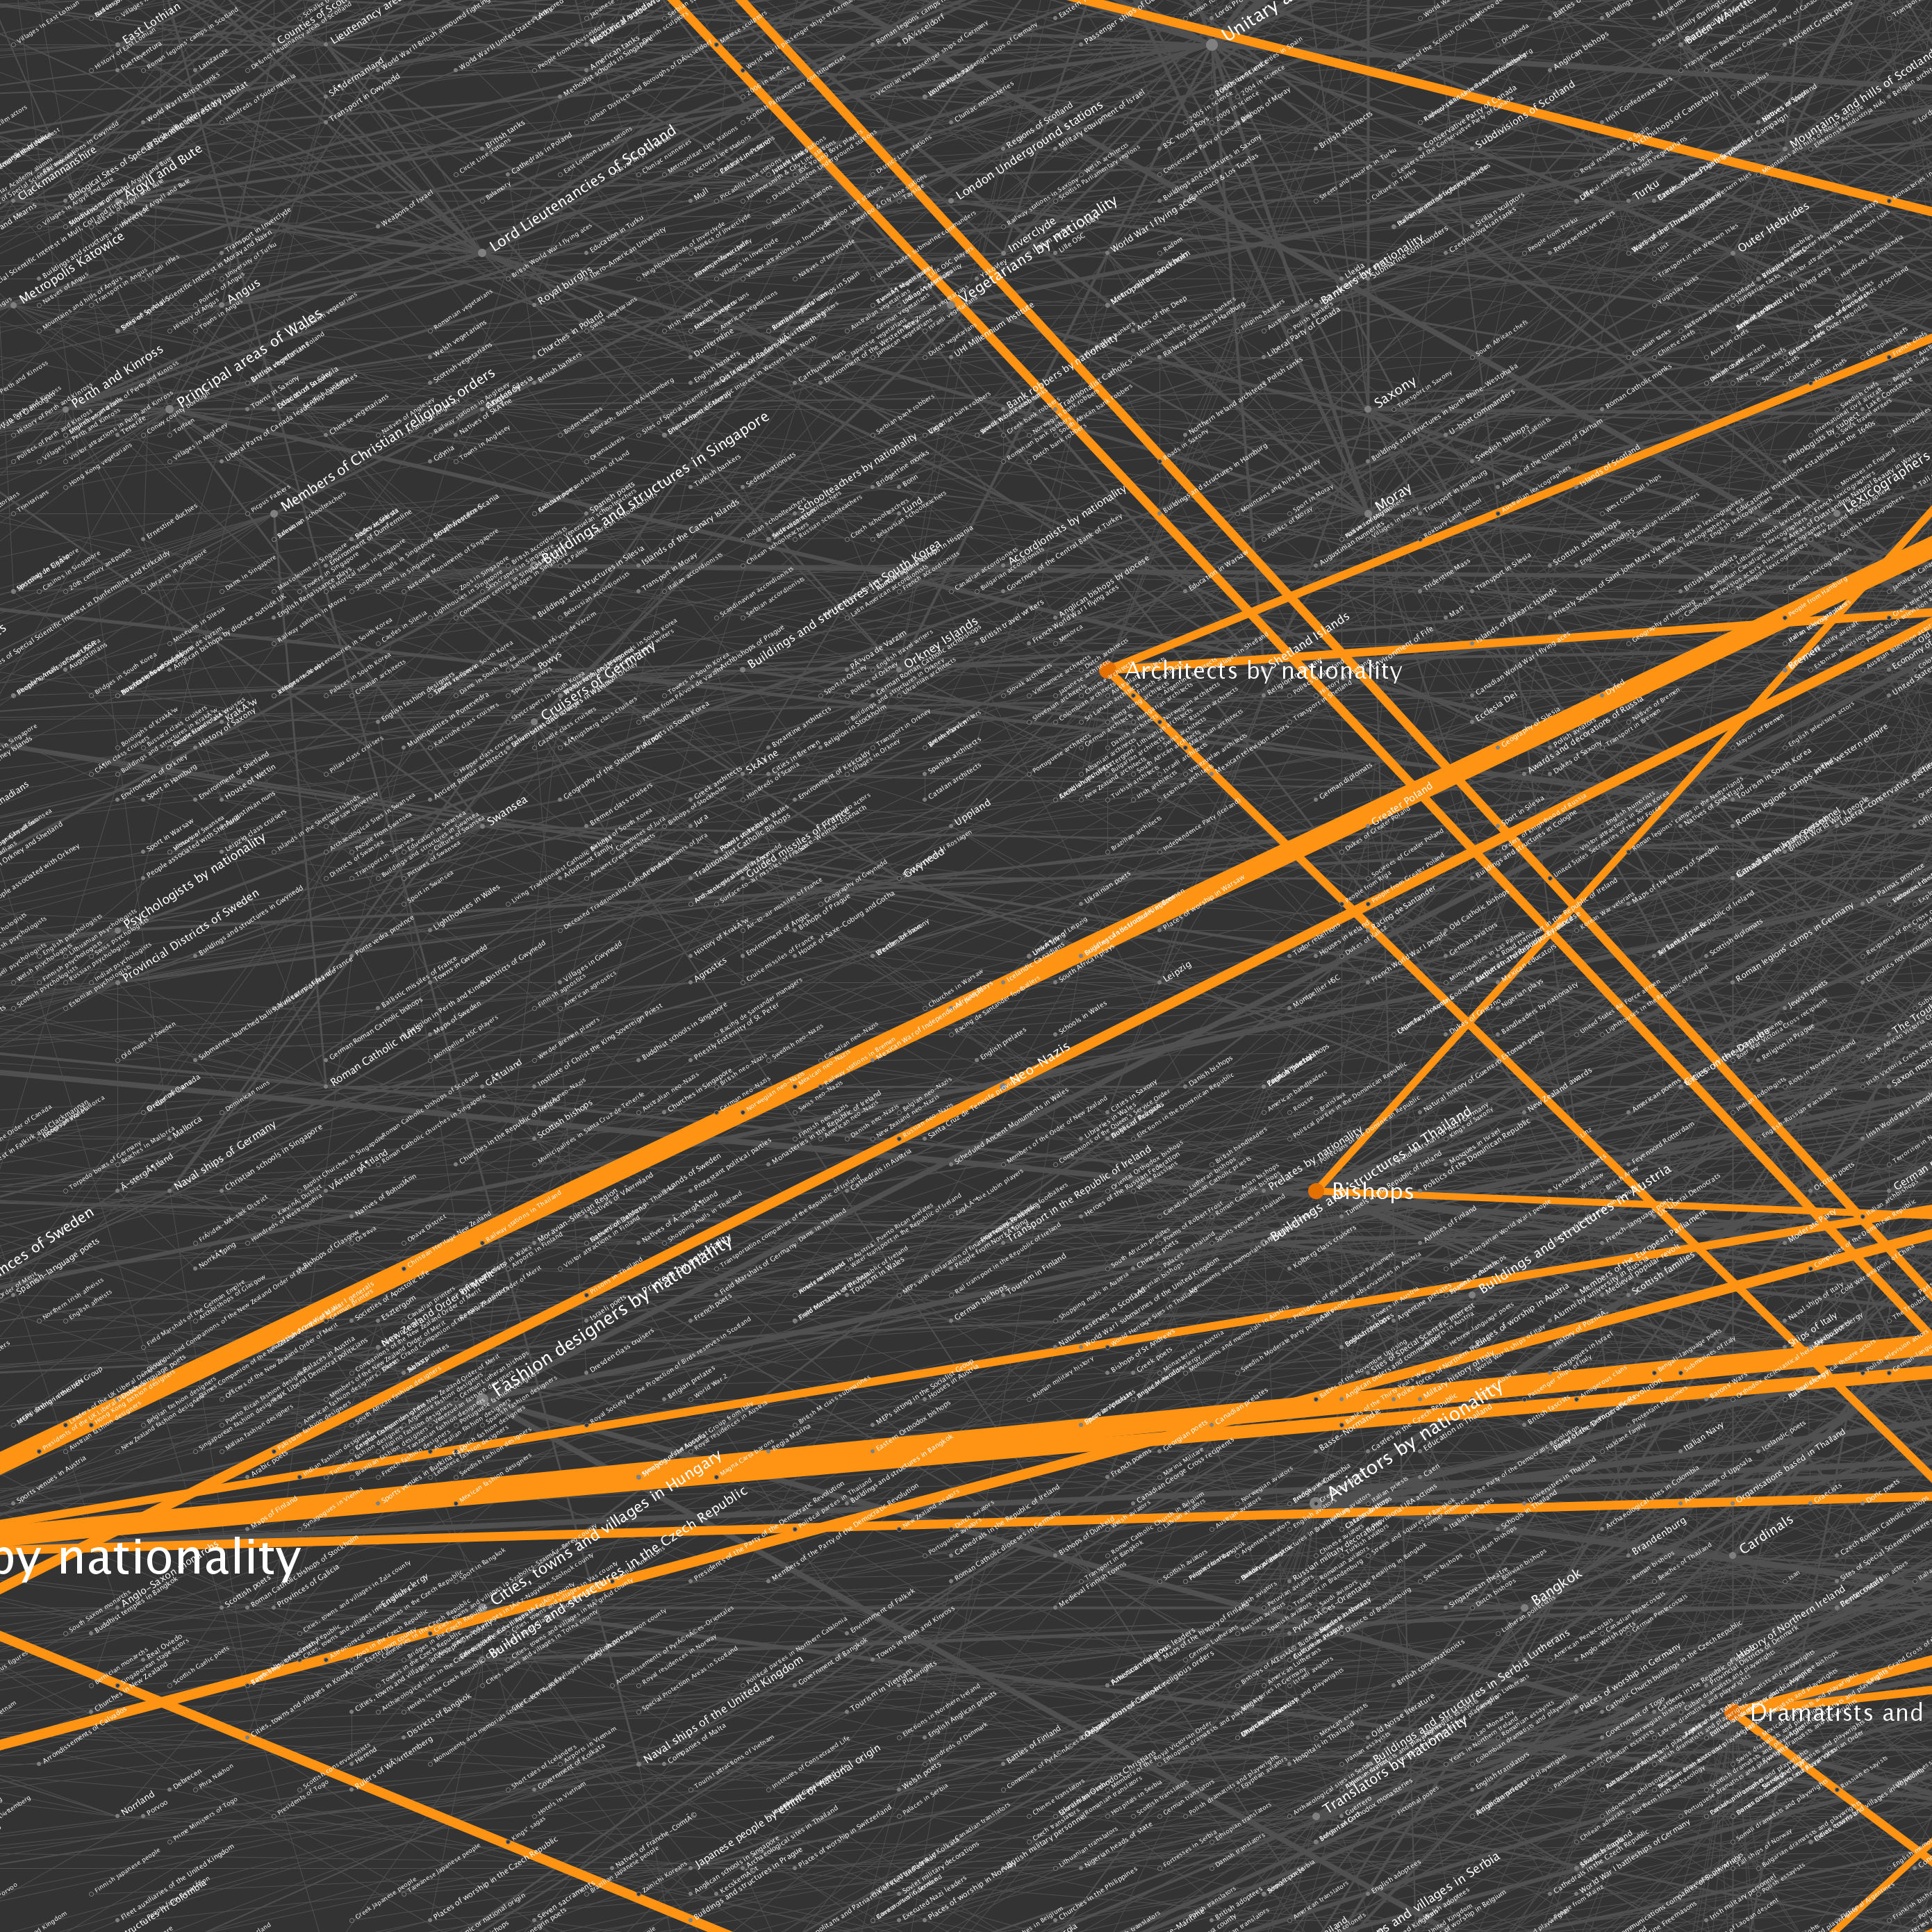
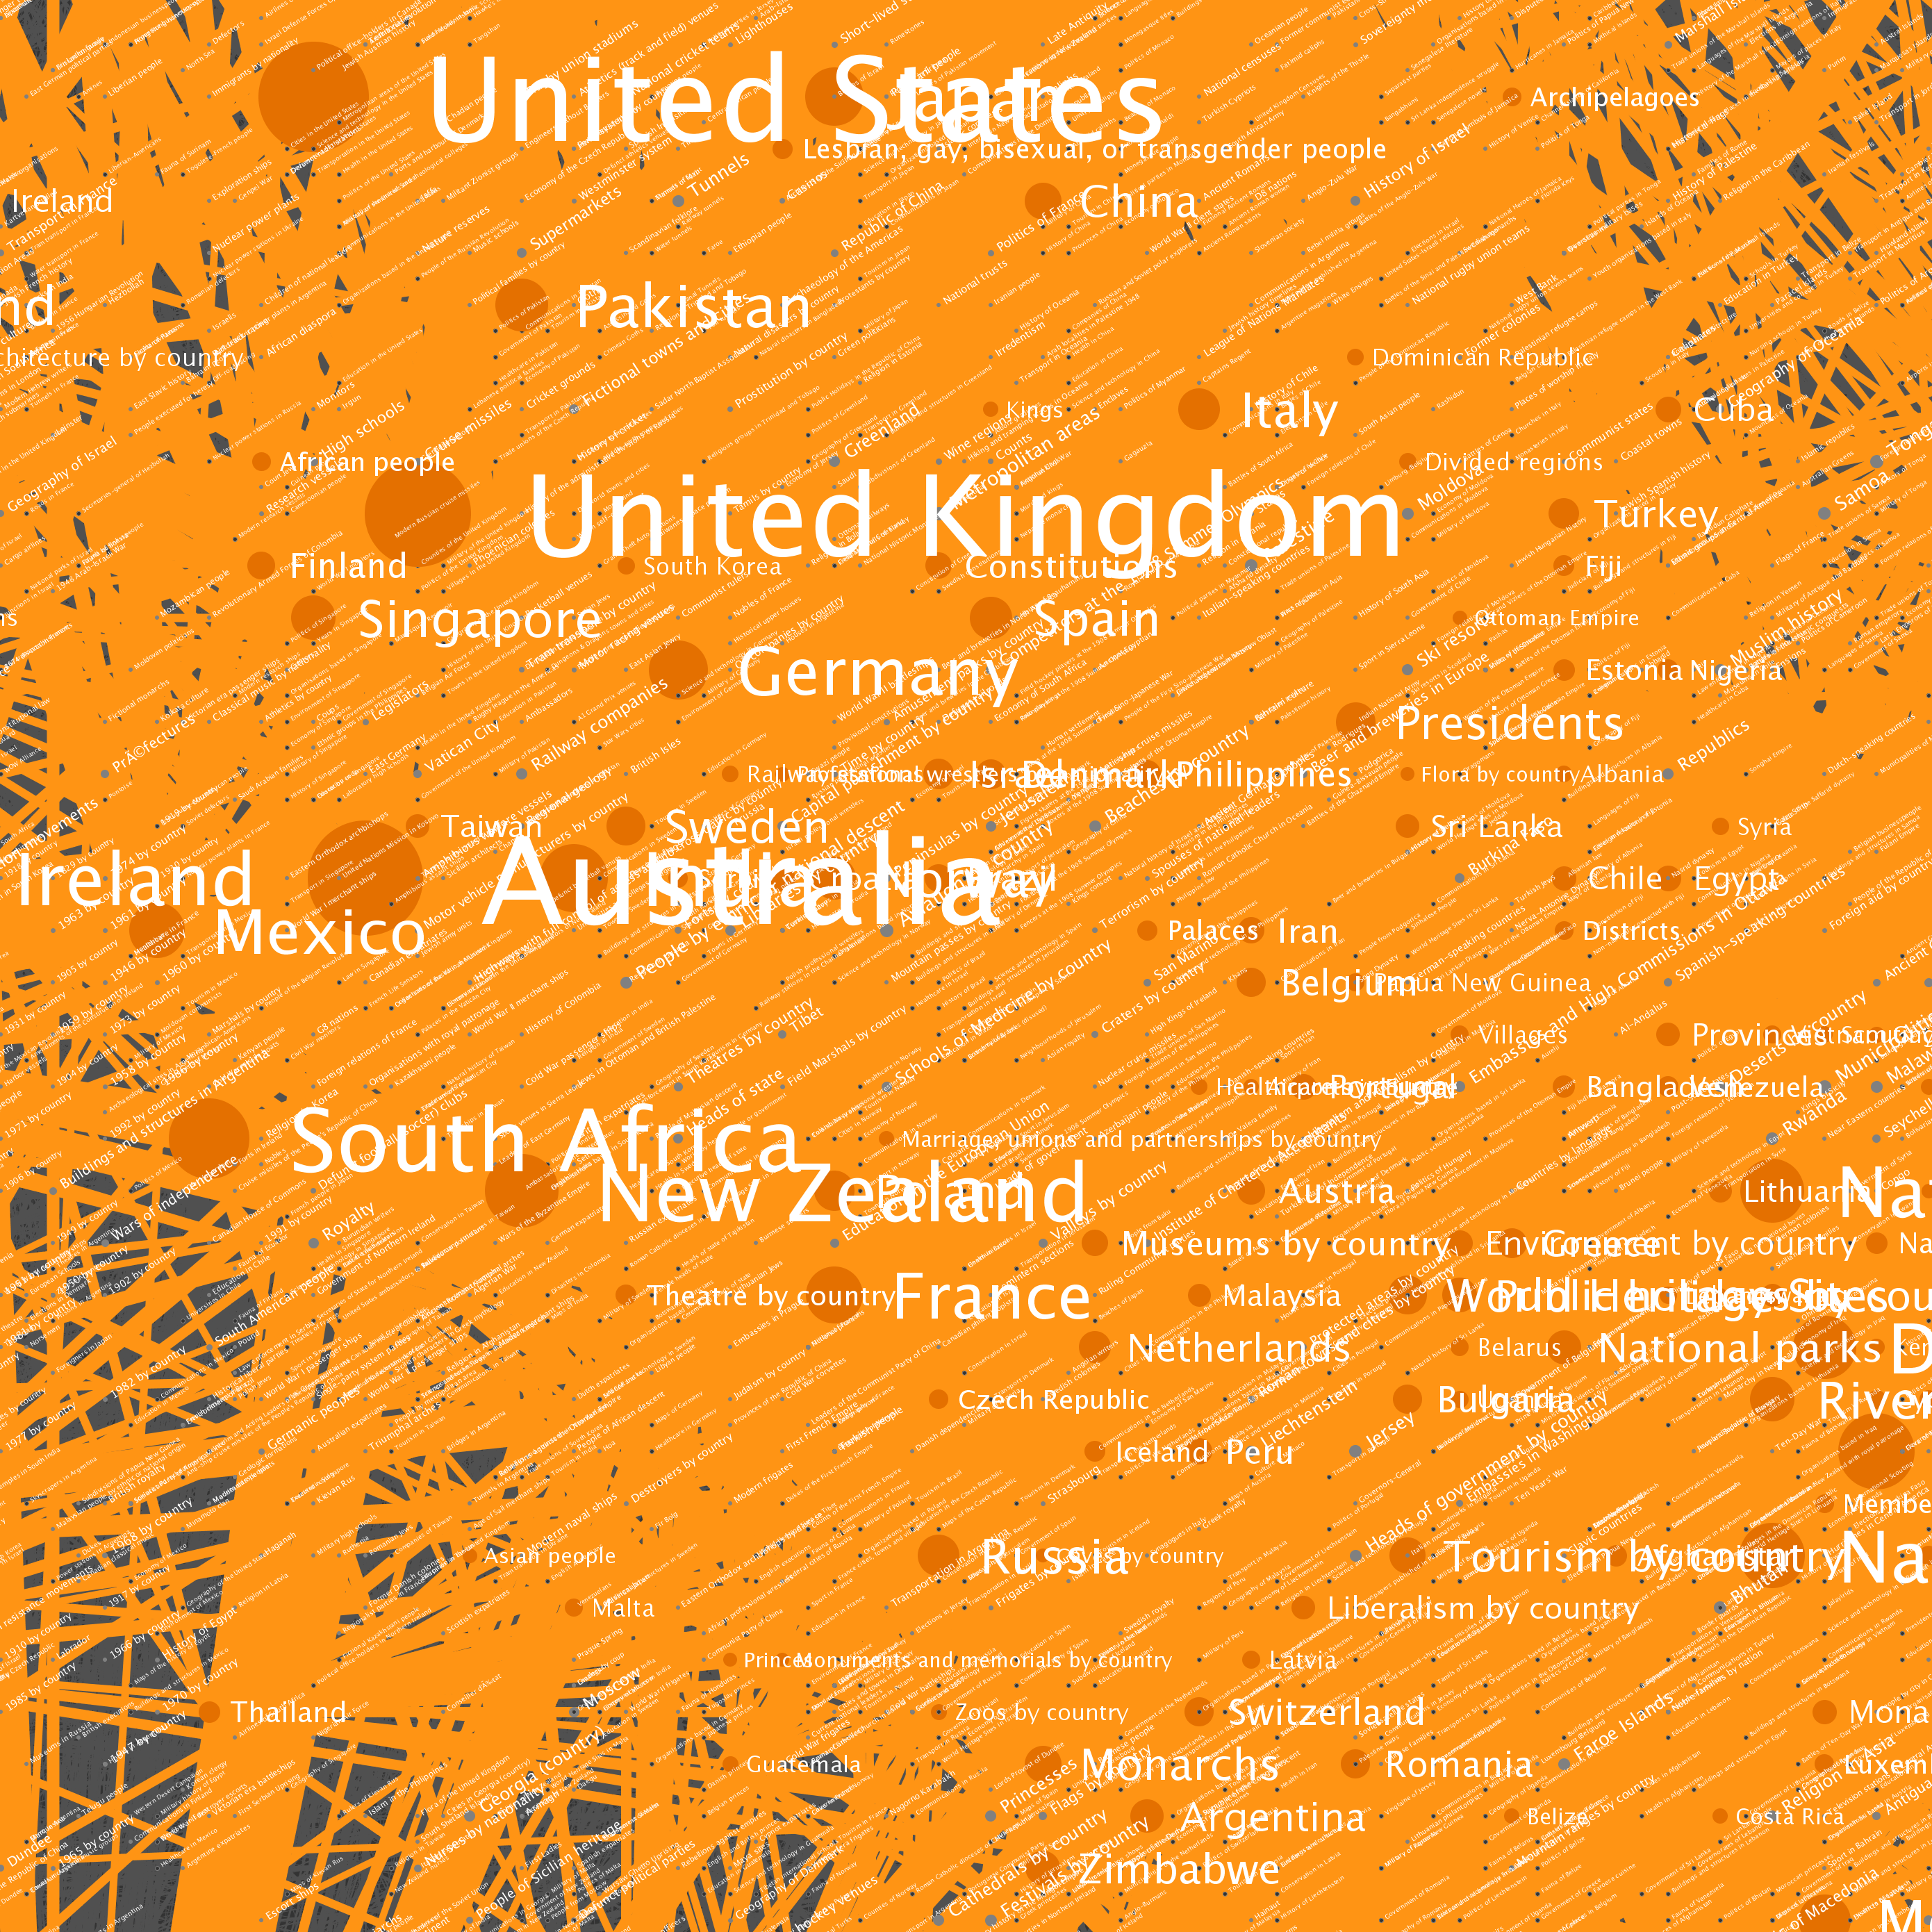
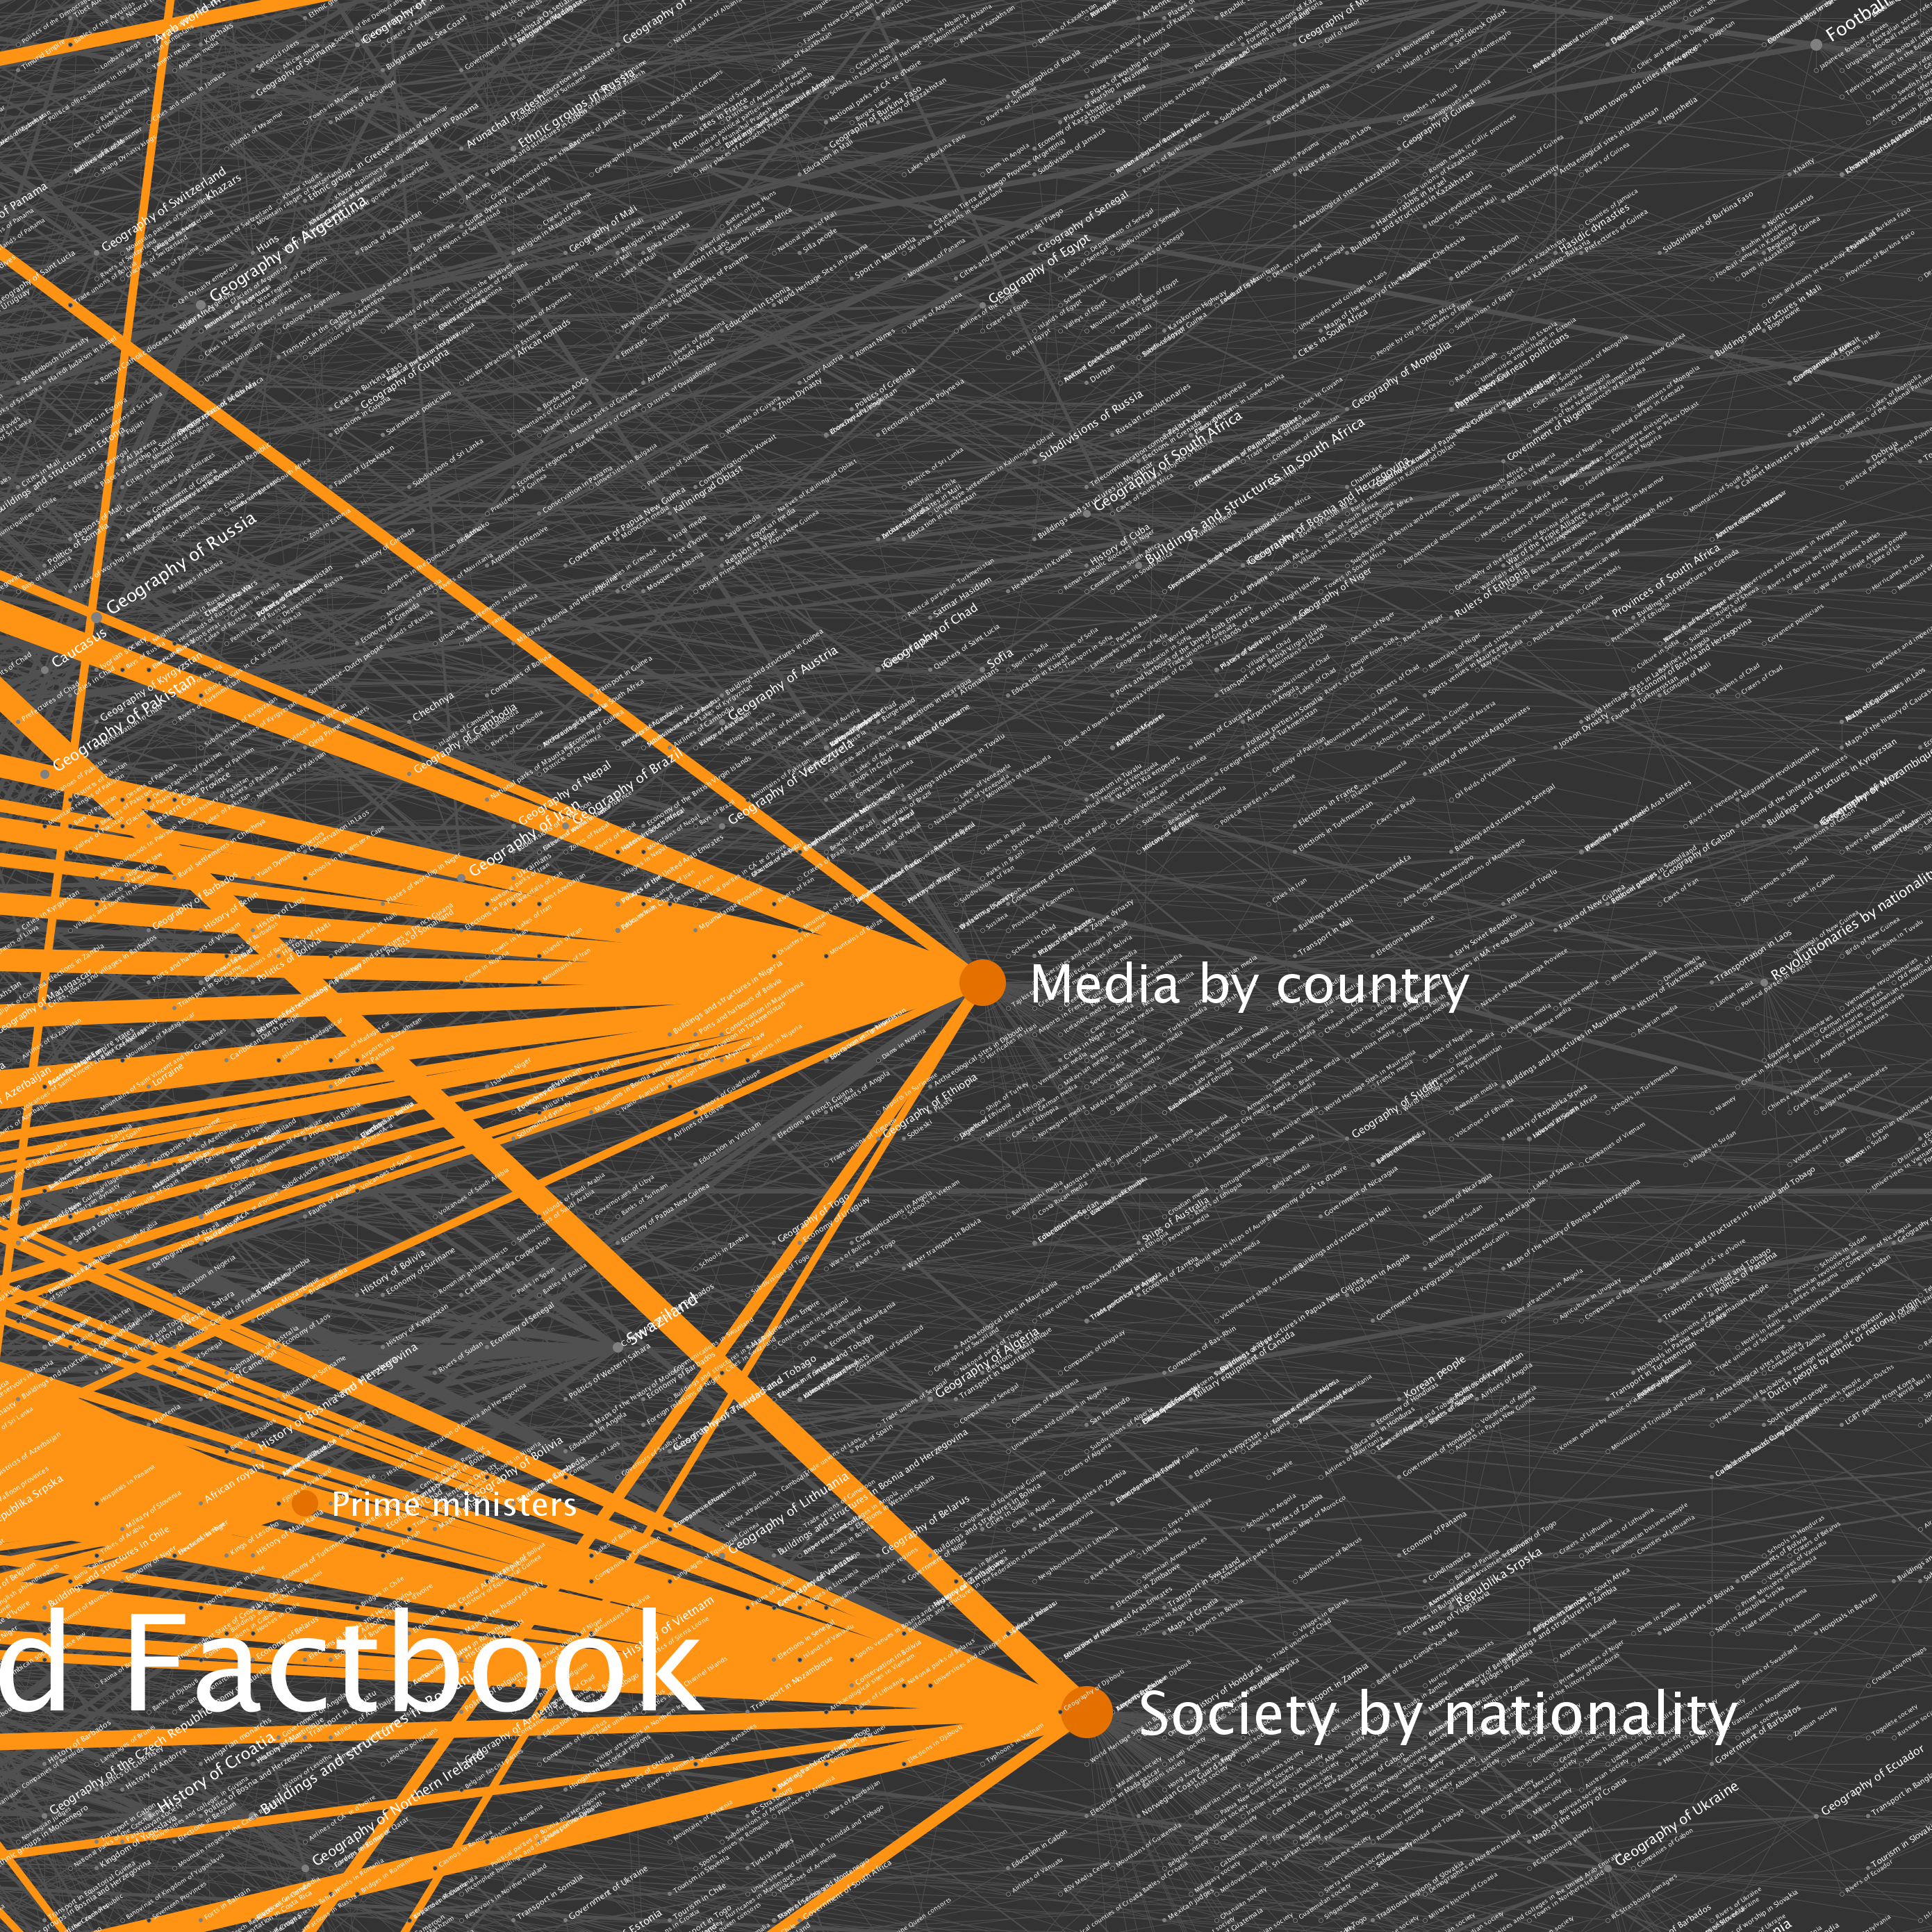
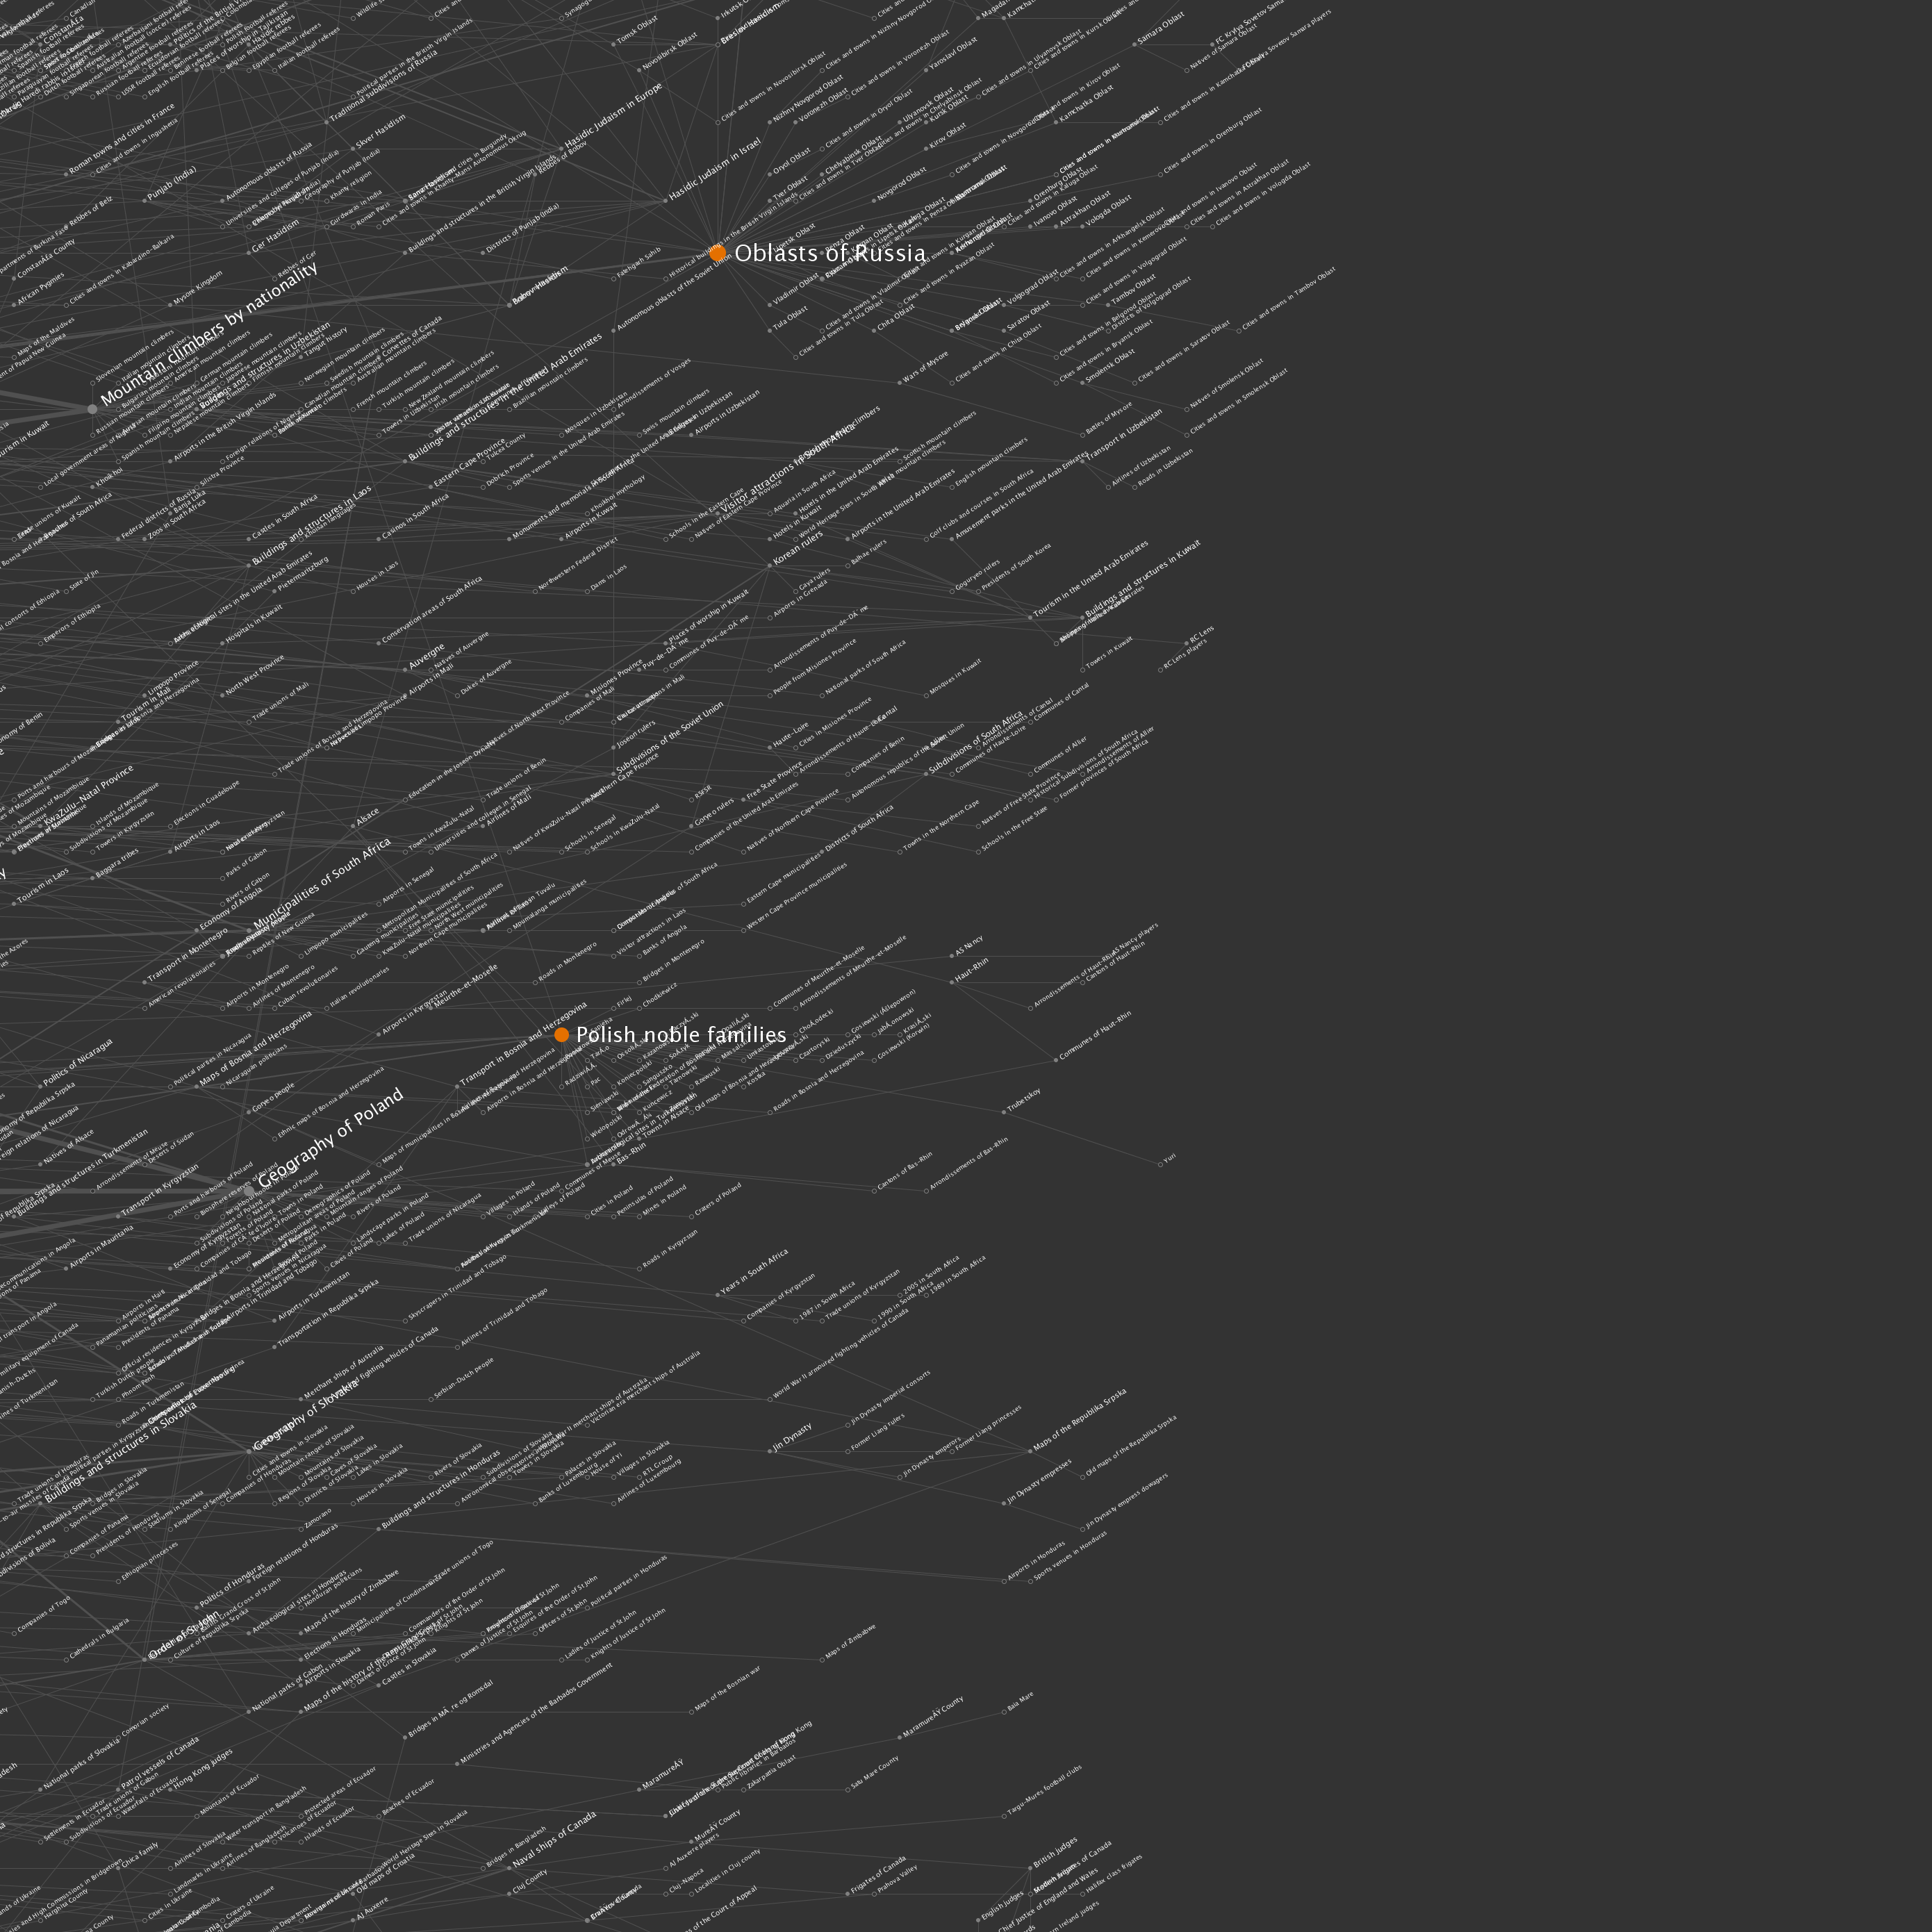
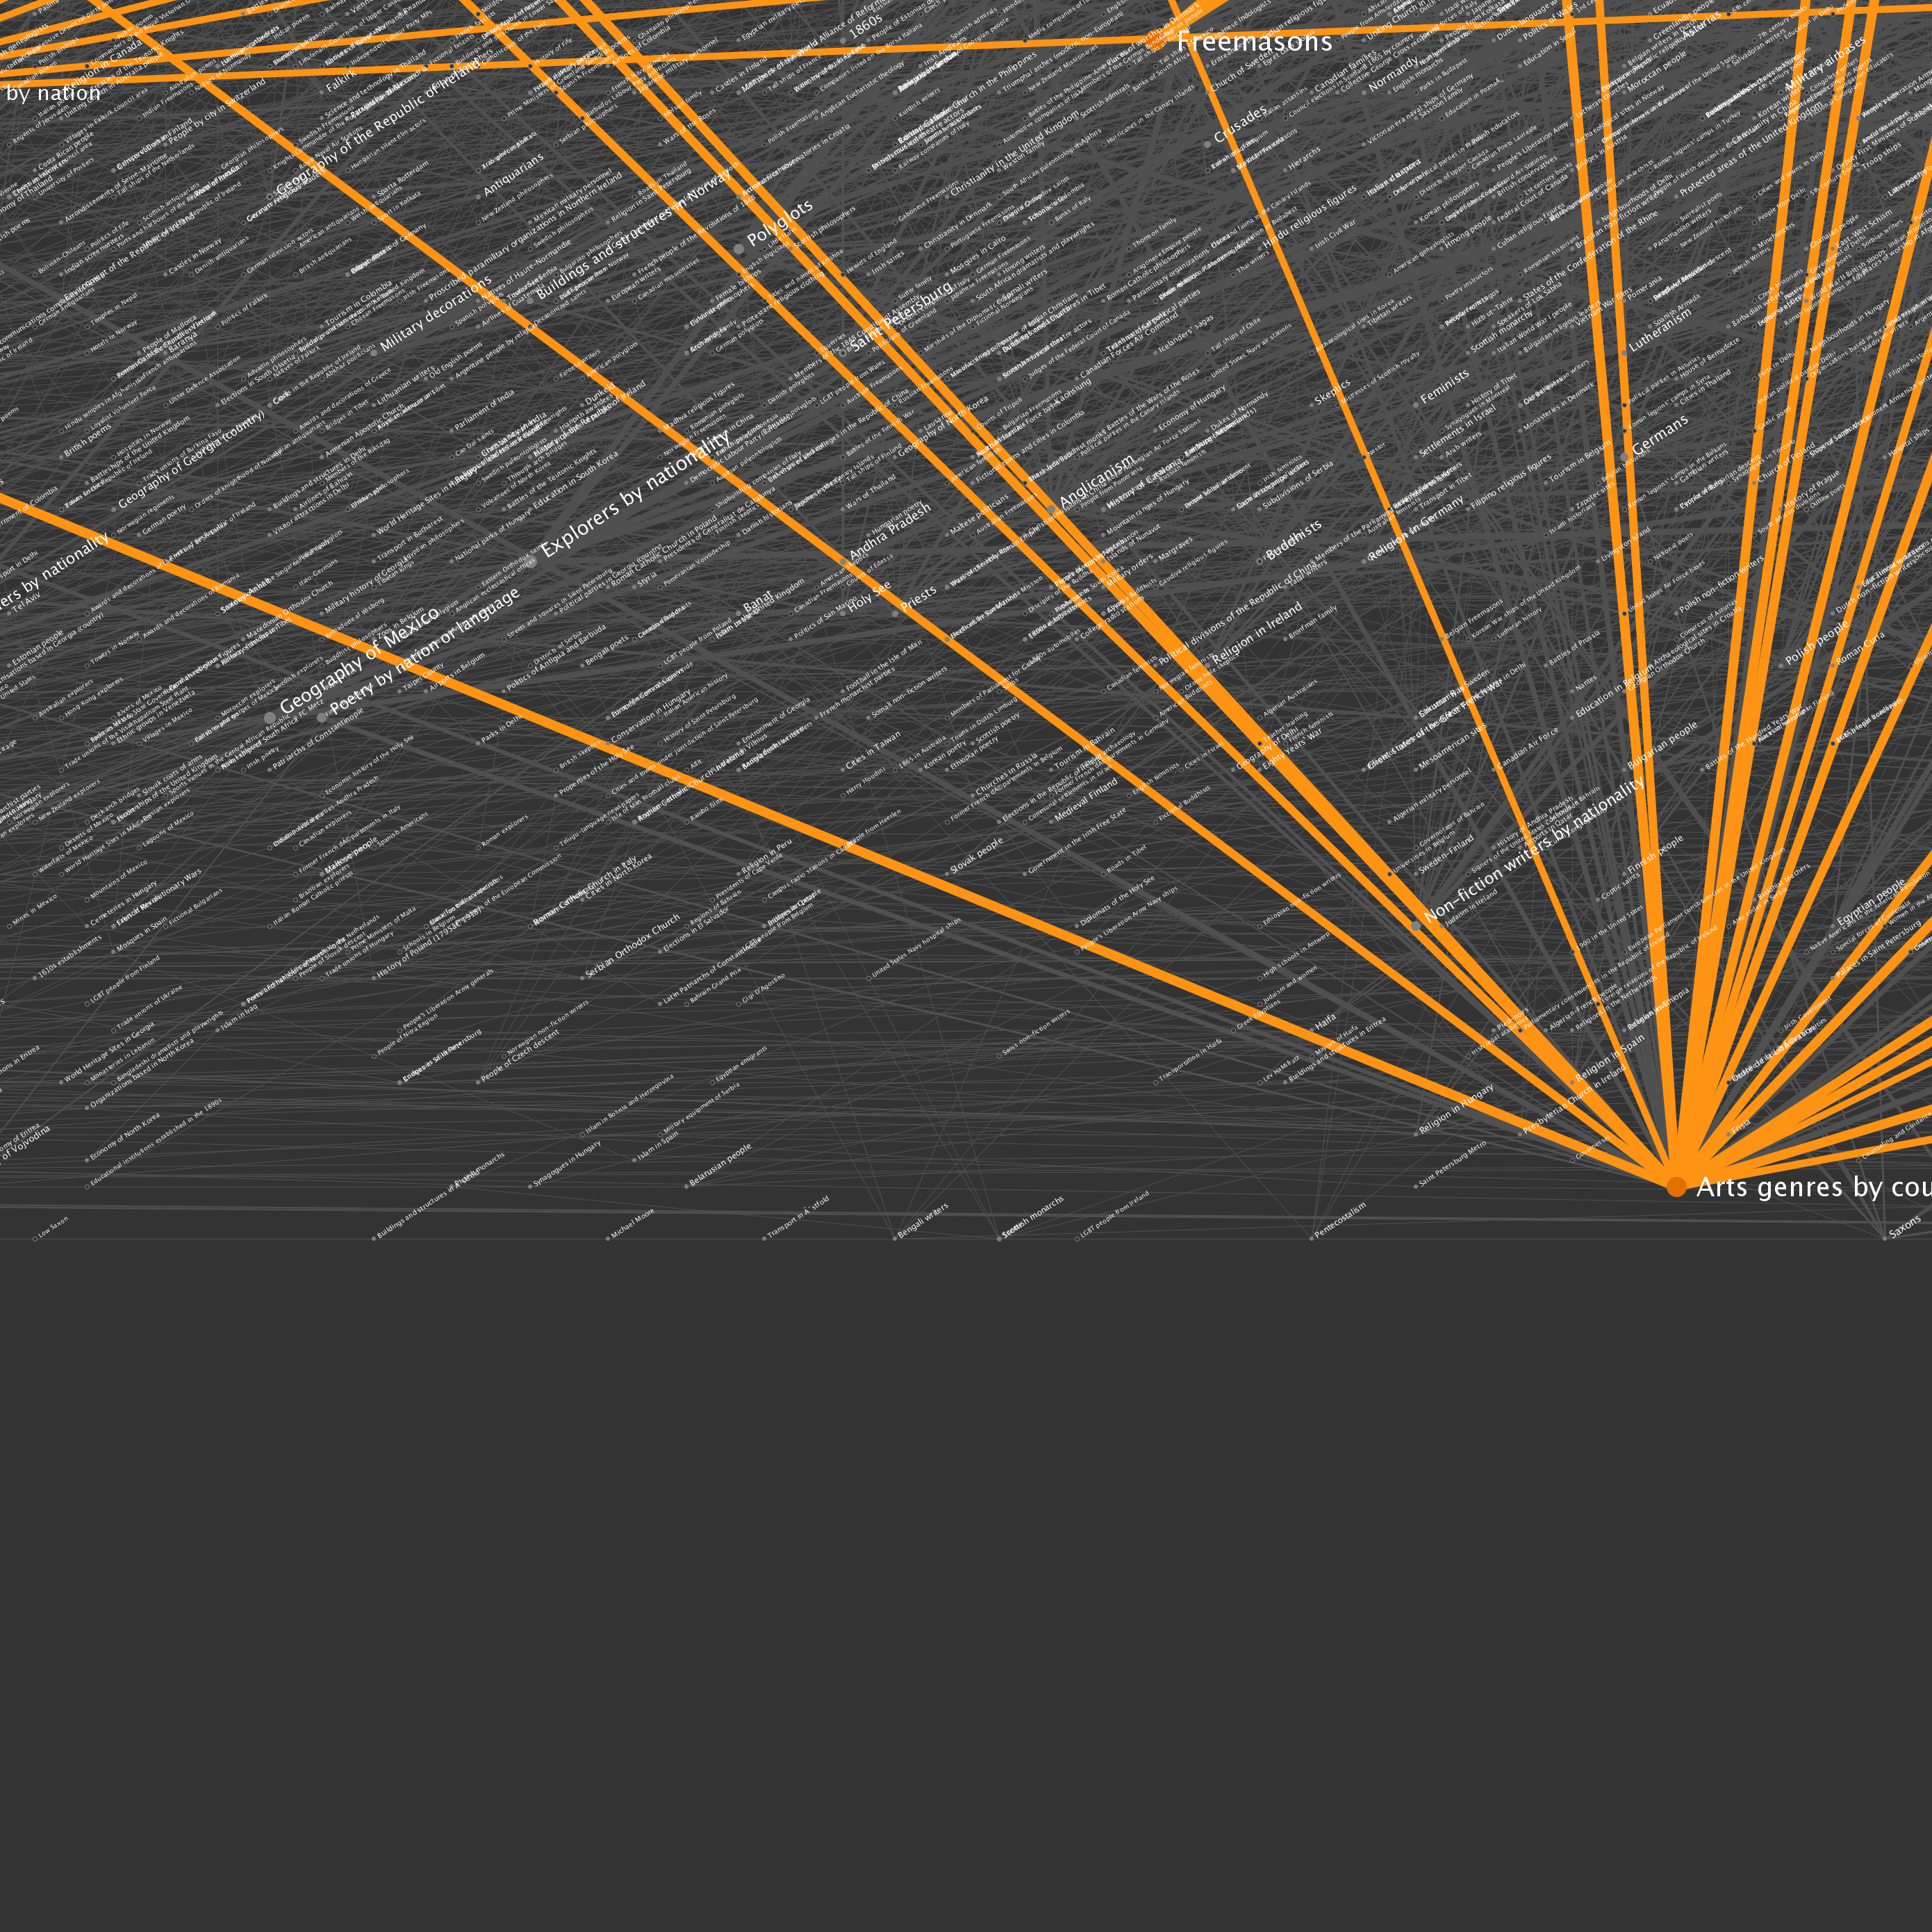
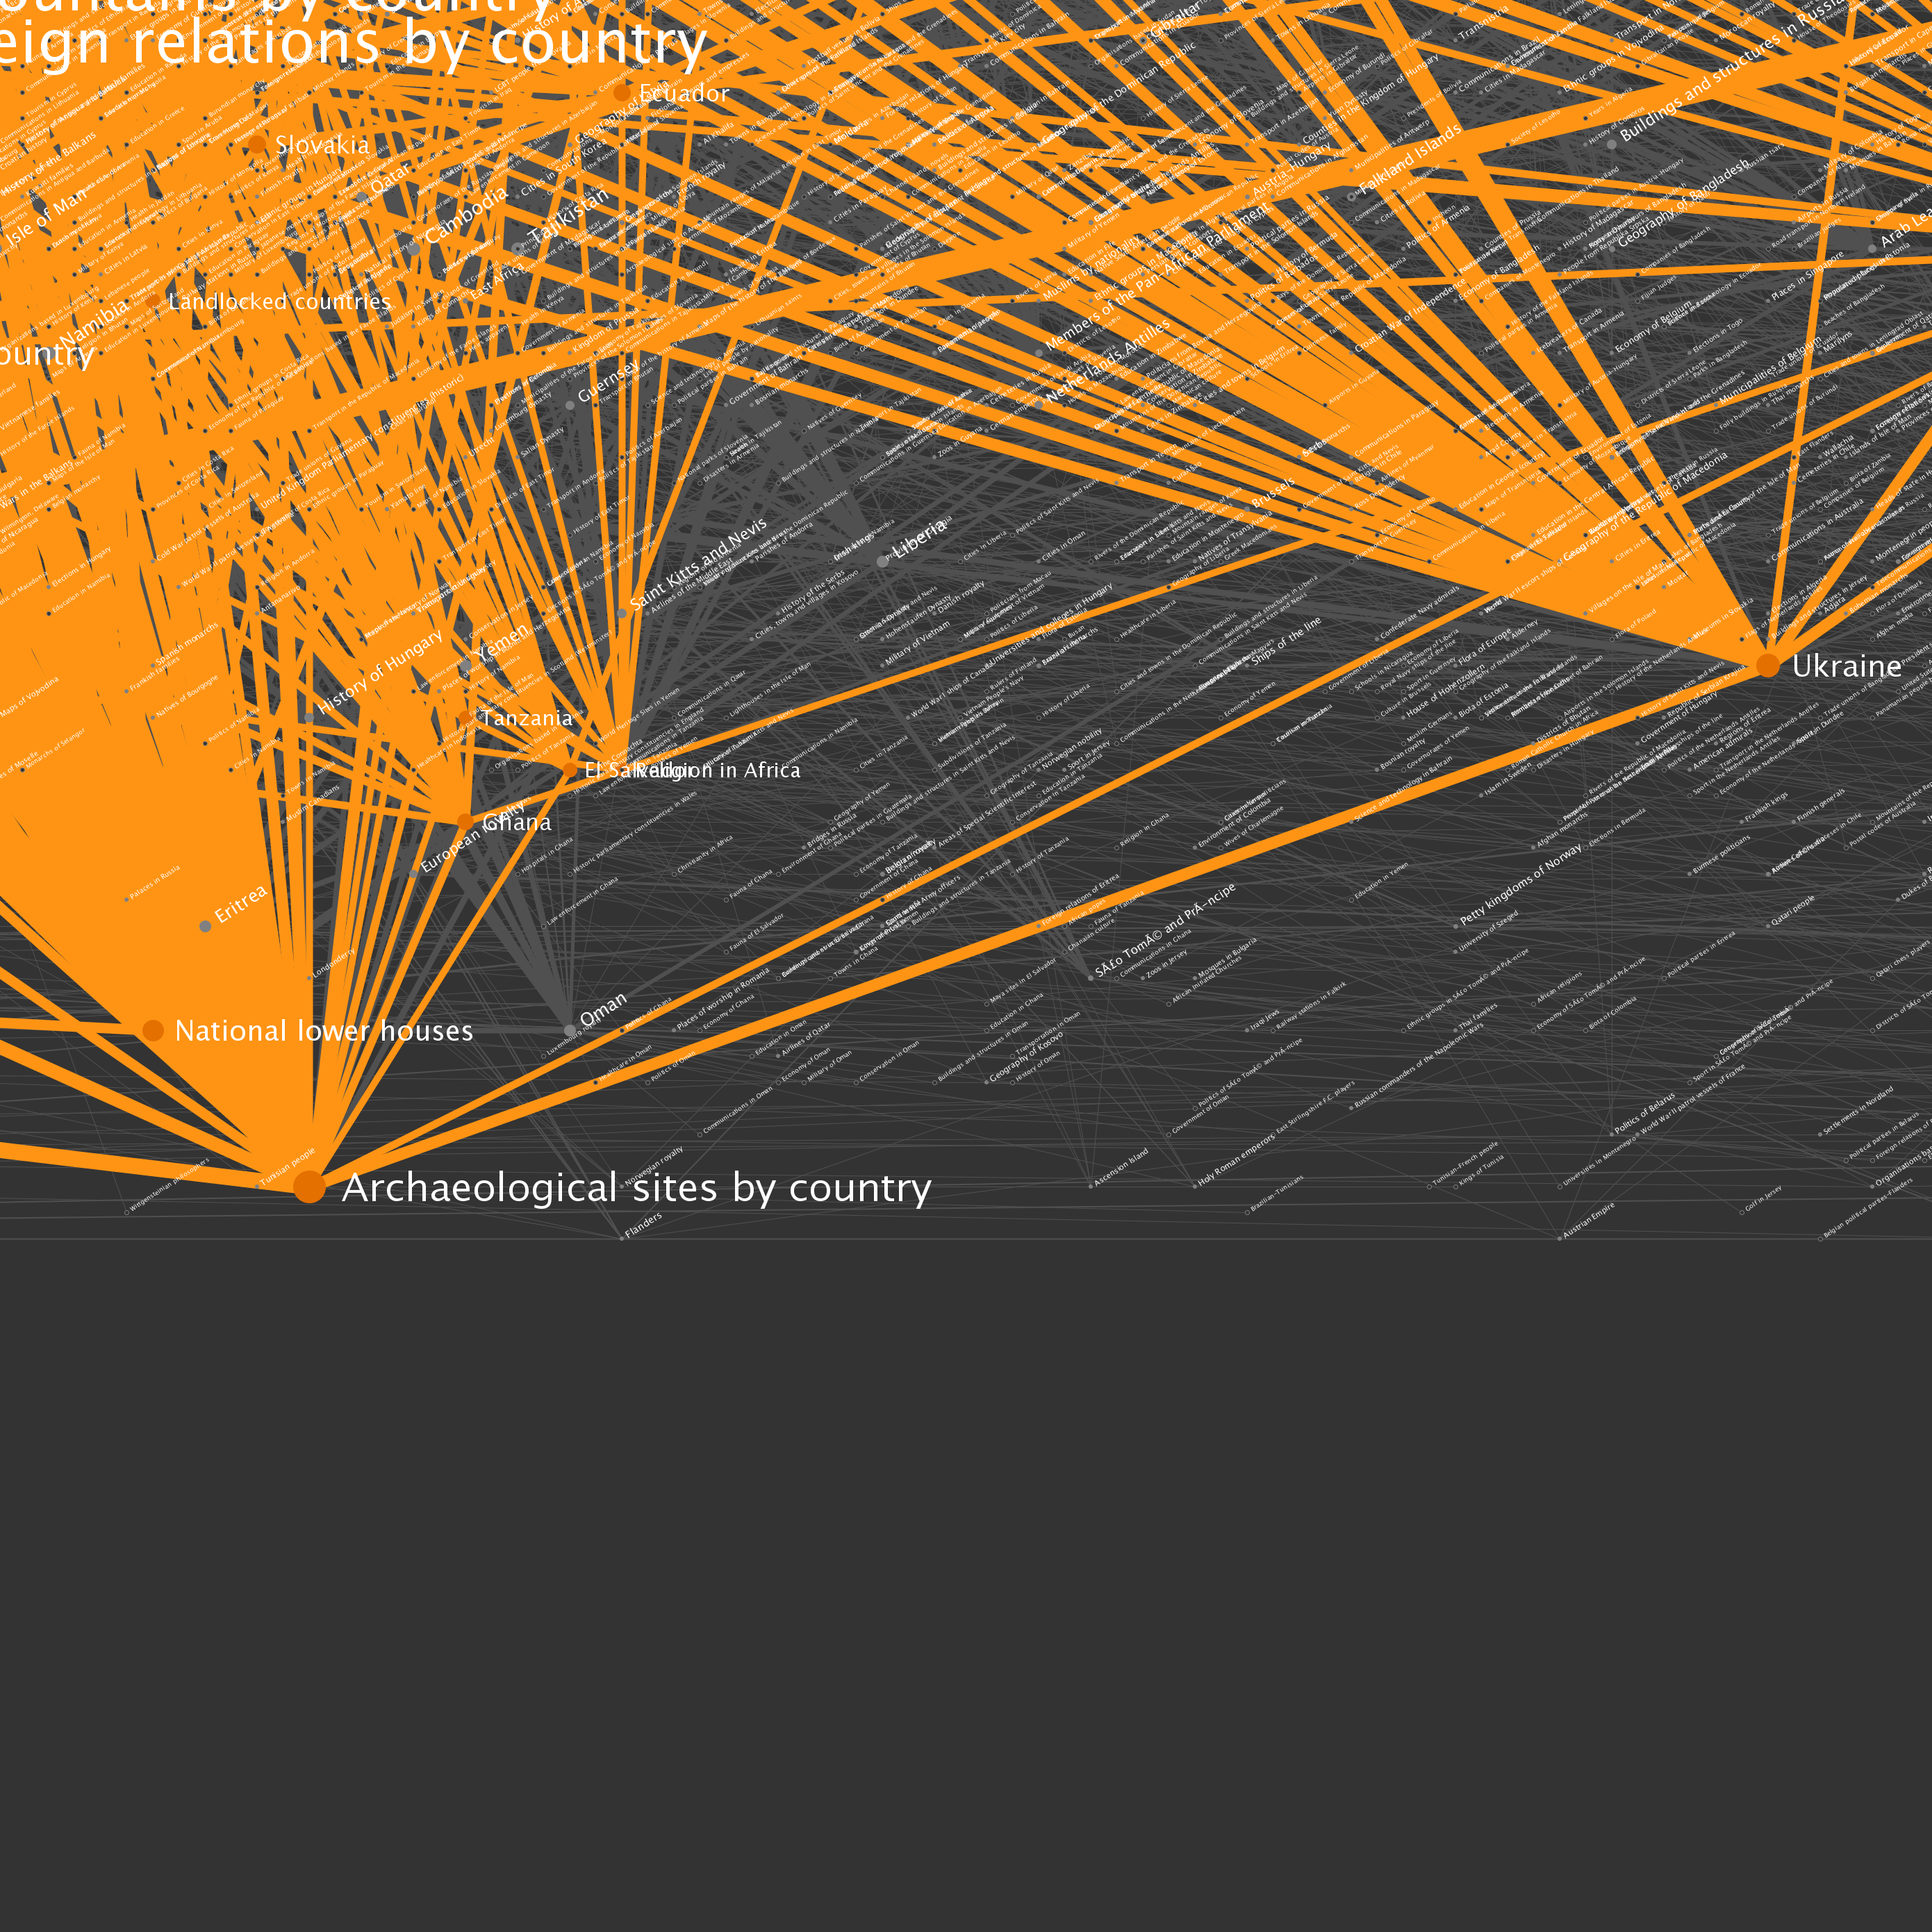
The fifth incarnation of WikiViz (v5) saw several significant improvements. Most notable was a new graph layout algorithm that allowed me to scale to hundreds of thousands or millions of vertices (tens of millions of edges). A traditional spring-based layout technique would choke at such quantities as they typically have (vertex)2 run times for repellent forces. However, much like a spring-based layout technique, connected vertices attracted each other, and were drawn together spatially. At a larger scale, this would cause highly connected clusters of vertices to coalesce. However, as my output improved, I began to realize that the data I was using from the Wikipedia category links table was messy and not representative of Wikipedia's true structure. The cl_to and cl_sortkey fields are not true links, although the topics are often related. To remedy this problem for future layout attempts, I have prepared a true page links input file with data scraped right from article content. When I get sufficient time to tinker again, I will attempt to render a full and accurate Wikipedia graph.
I have included a few sample renderings for those who are curious.
 |  |
| Five levels deep, centered on History (WikiViz v5) | Five levels deep, centered on Politics (WikiViz v5) |
 |  |
| Five levels deep, centered on Religion (WikiViz v5) | Five levels deep, centered on Music (WikiViz v5) |
| A |
B |
C |
D |
E |
F |
G |
H |
|
1 |
 |
 |
 |
 |
 |
 |
 |
 |
2 |
 |
 |
 |
 |
 |
 |
 |
 |
3 |
 |
 |
 |
 |
 |
 |
 |
 |
4 |
 |
 |
 |
 |
 |
 |
 |
 |
5 |
 |
 |
 |
 |
 |
 |
 |
 |
6 |
 |
 |
 |
 |
 |
 |
 |
 |
7 |
 |
 |
 |
 |
 |
 |
 |
 |
8 |
 |
 |
 |
 |
 |
 |
 |
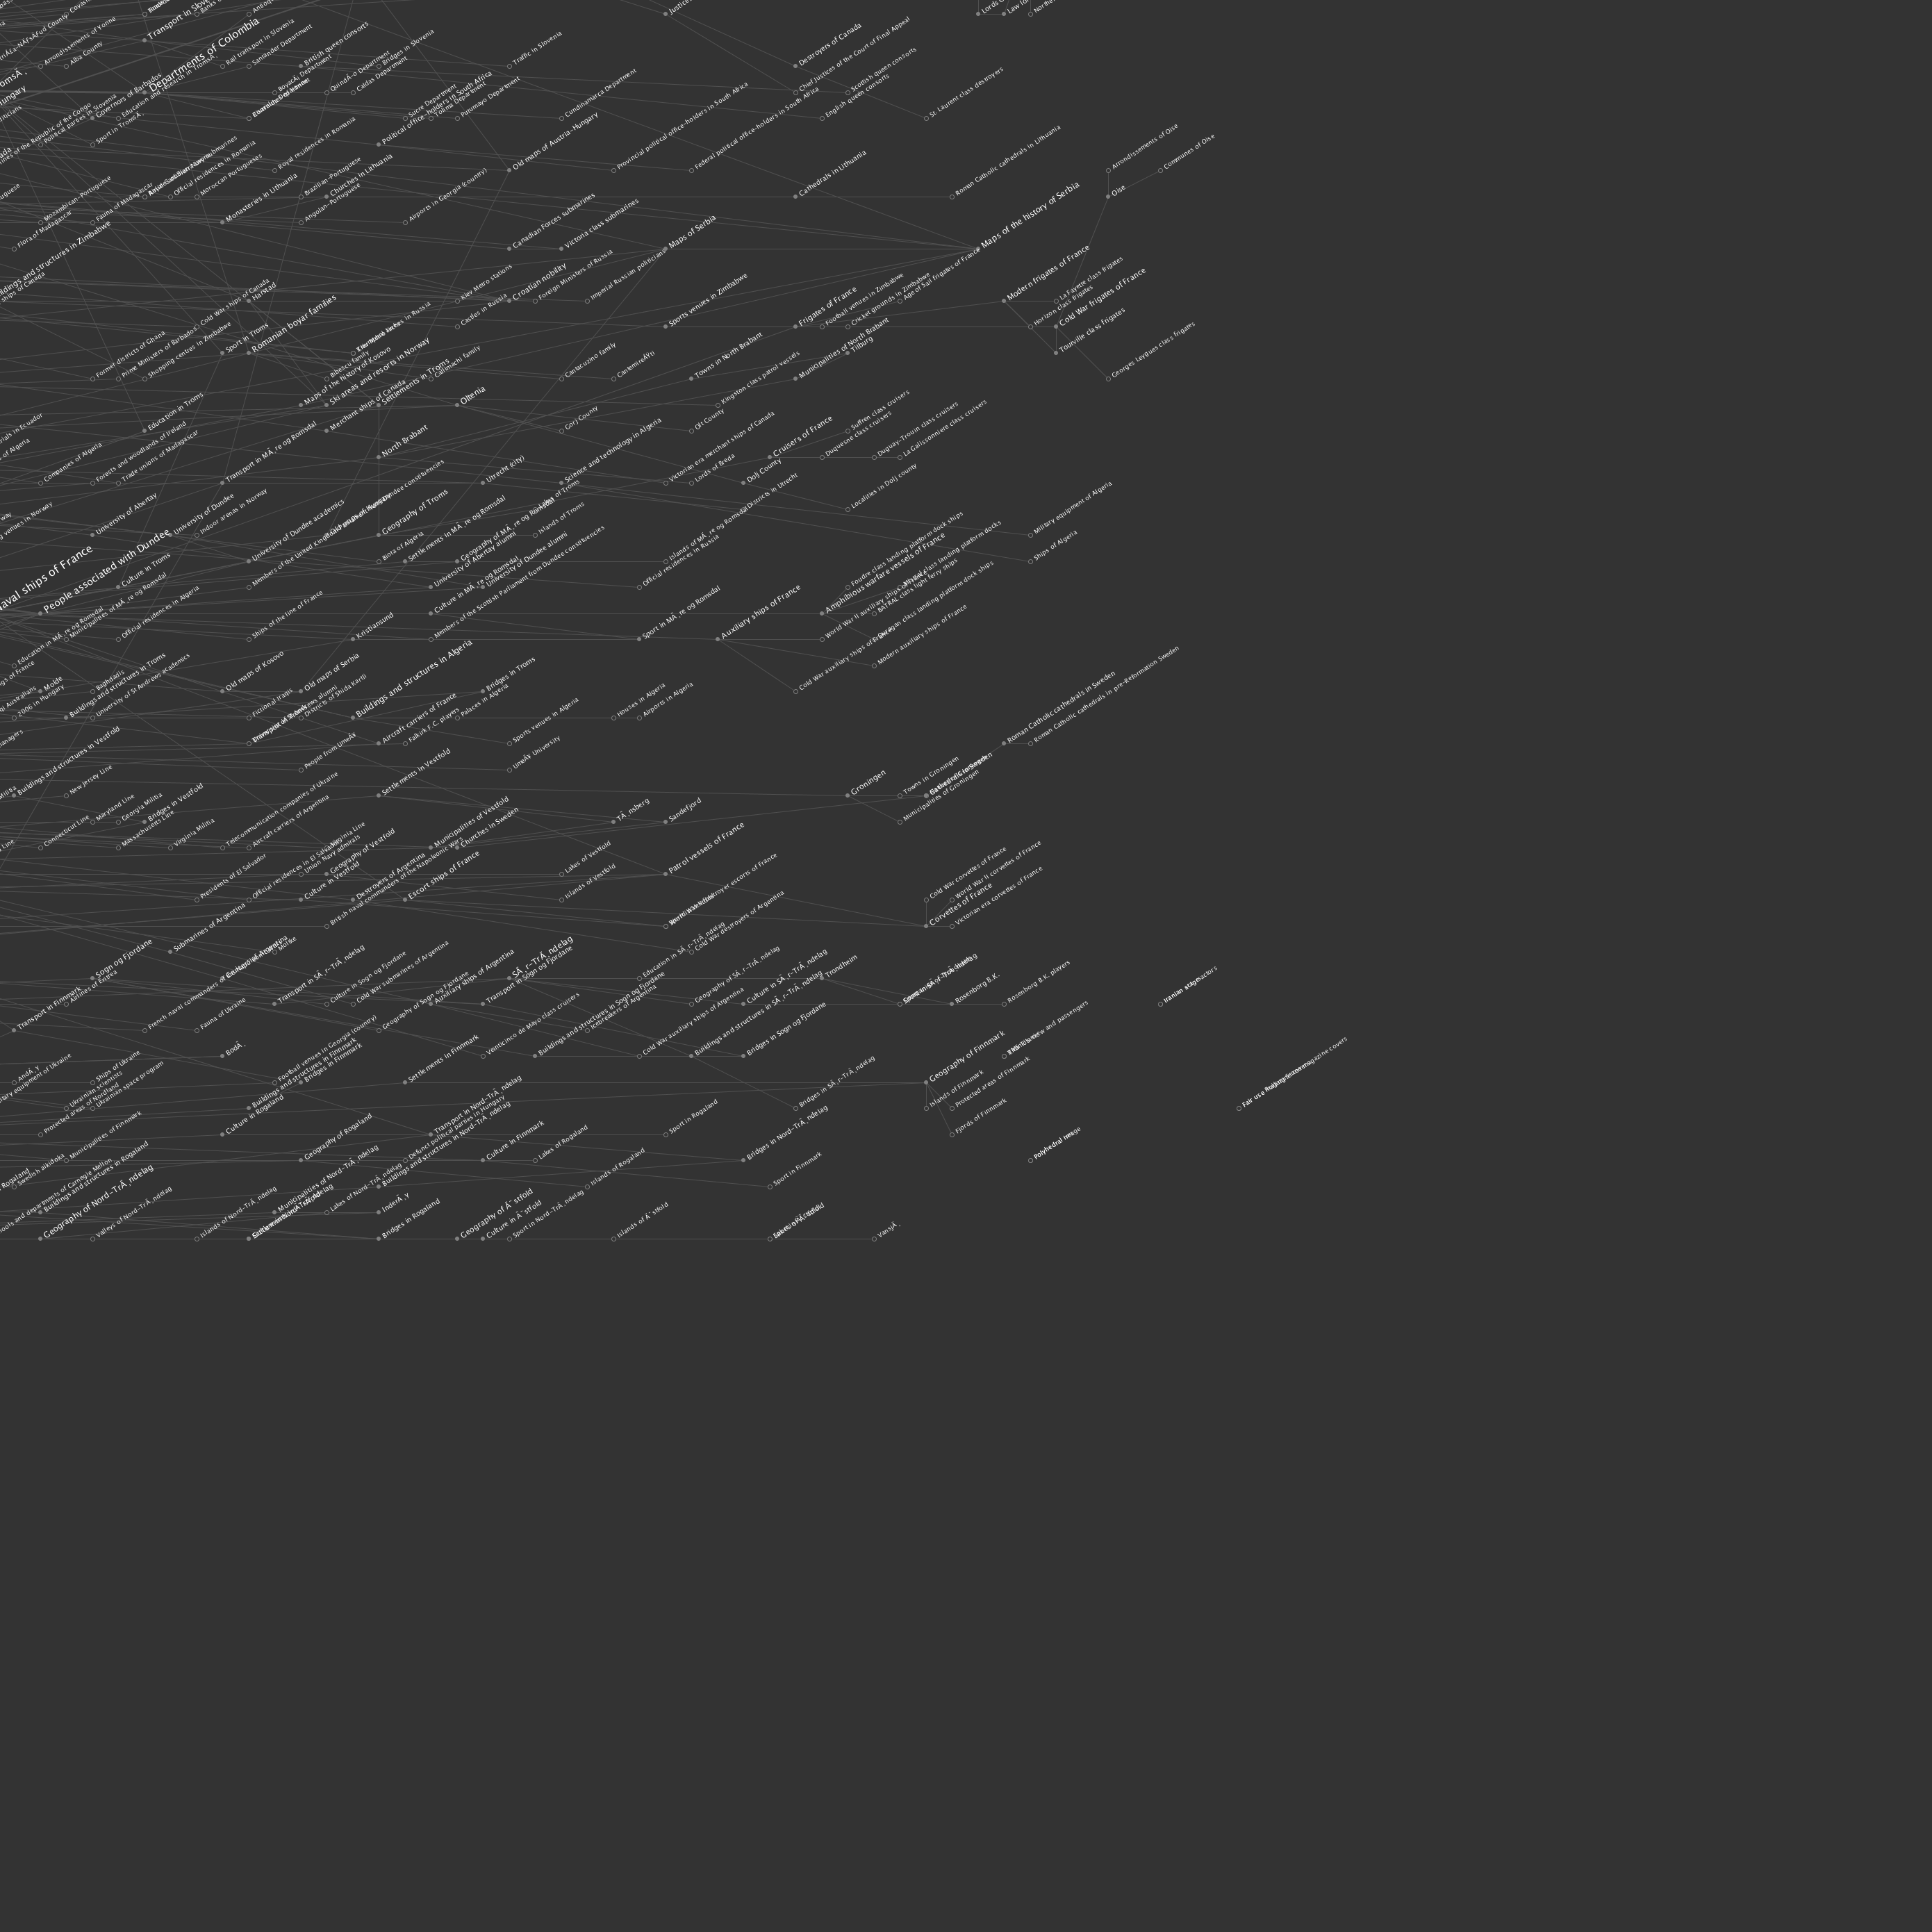 |
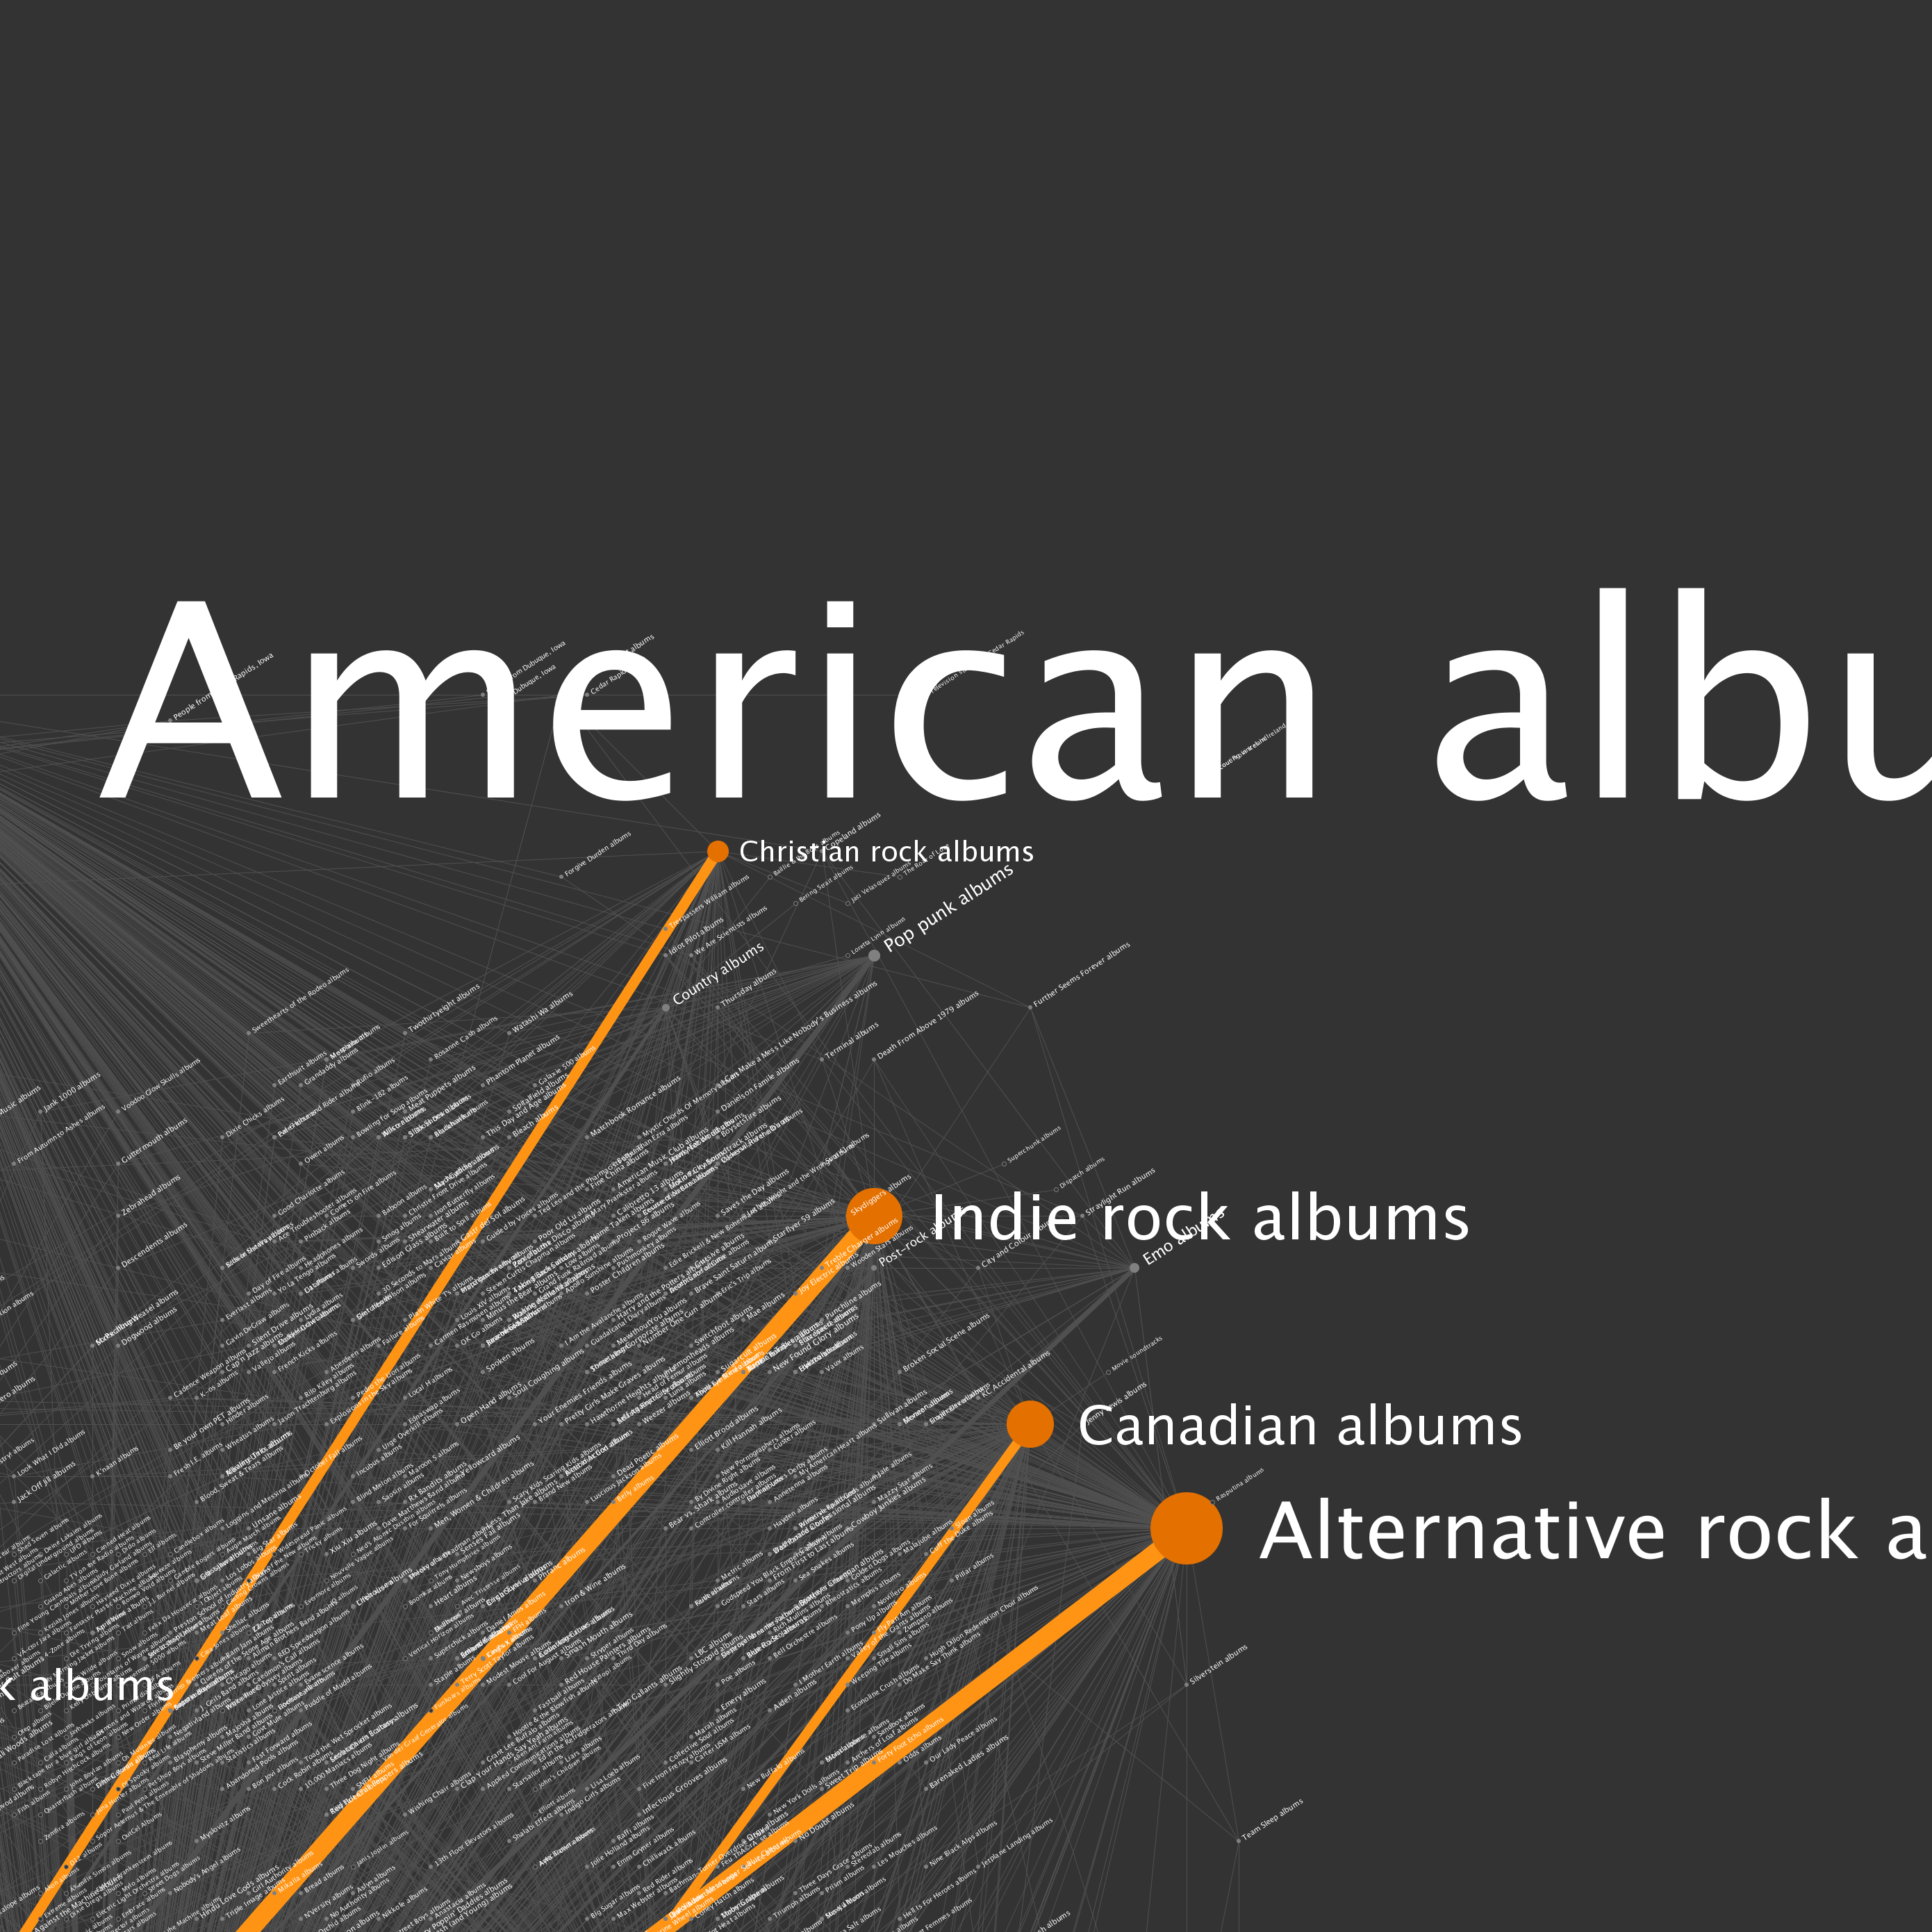
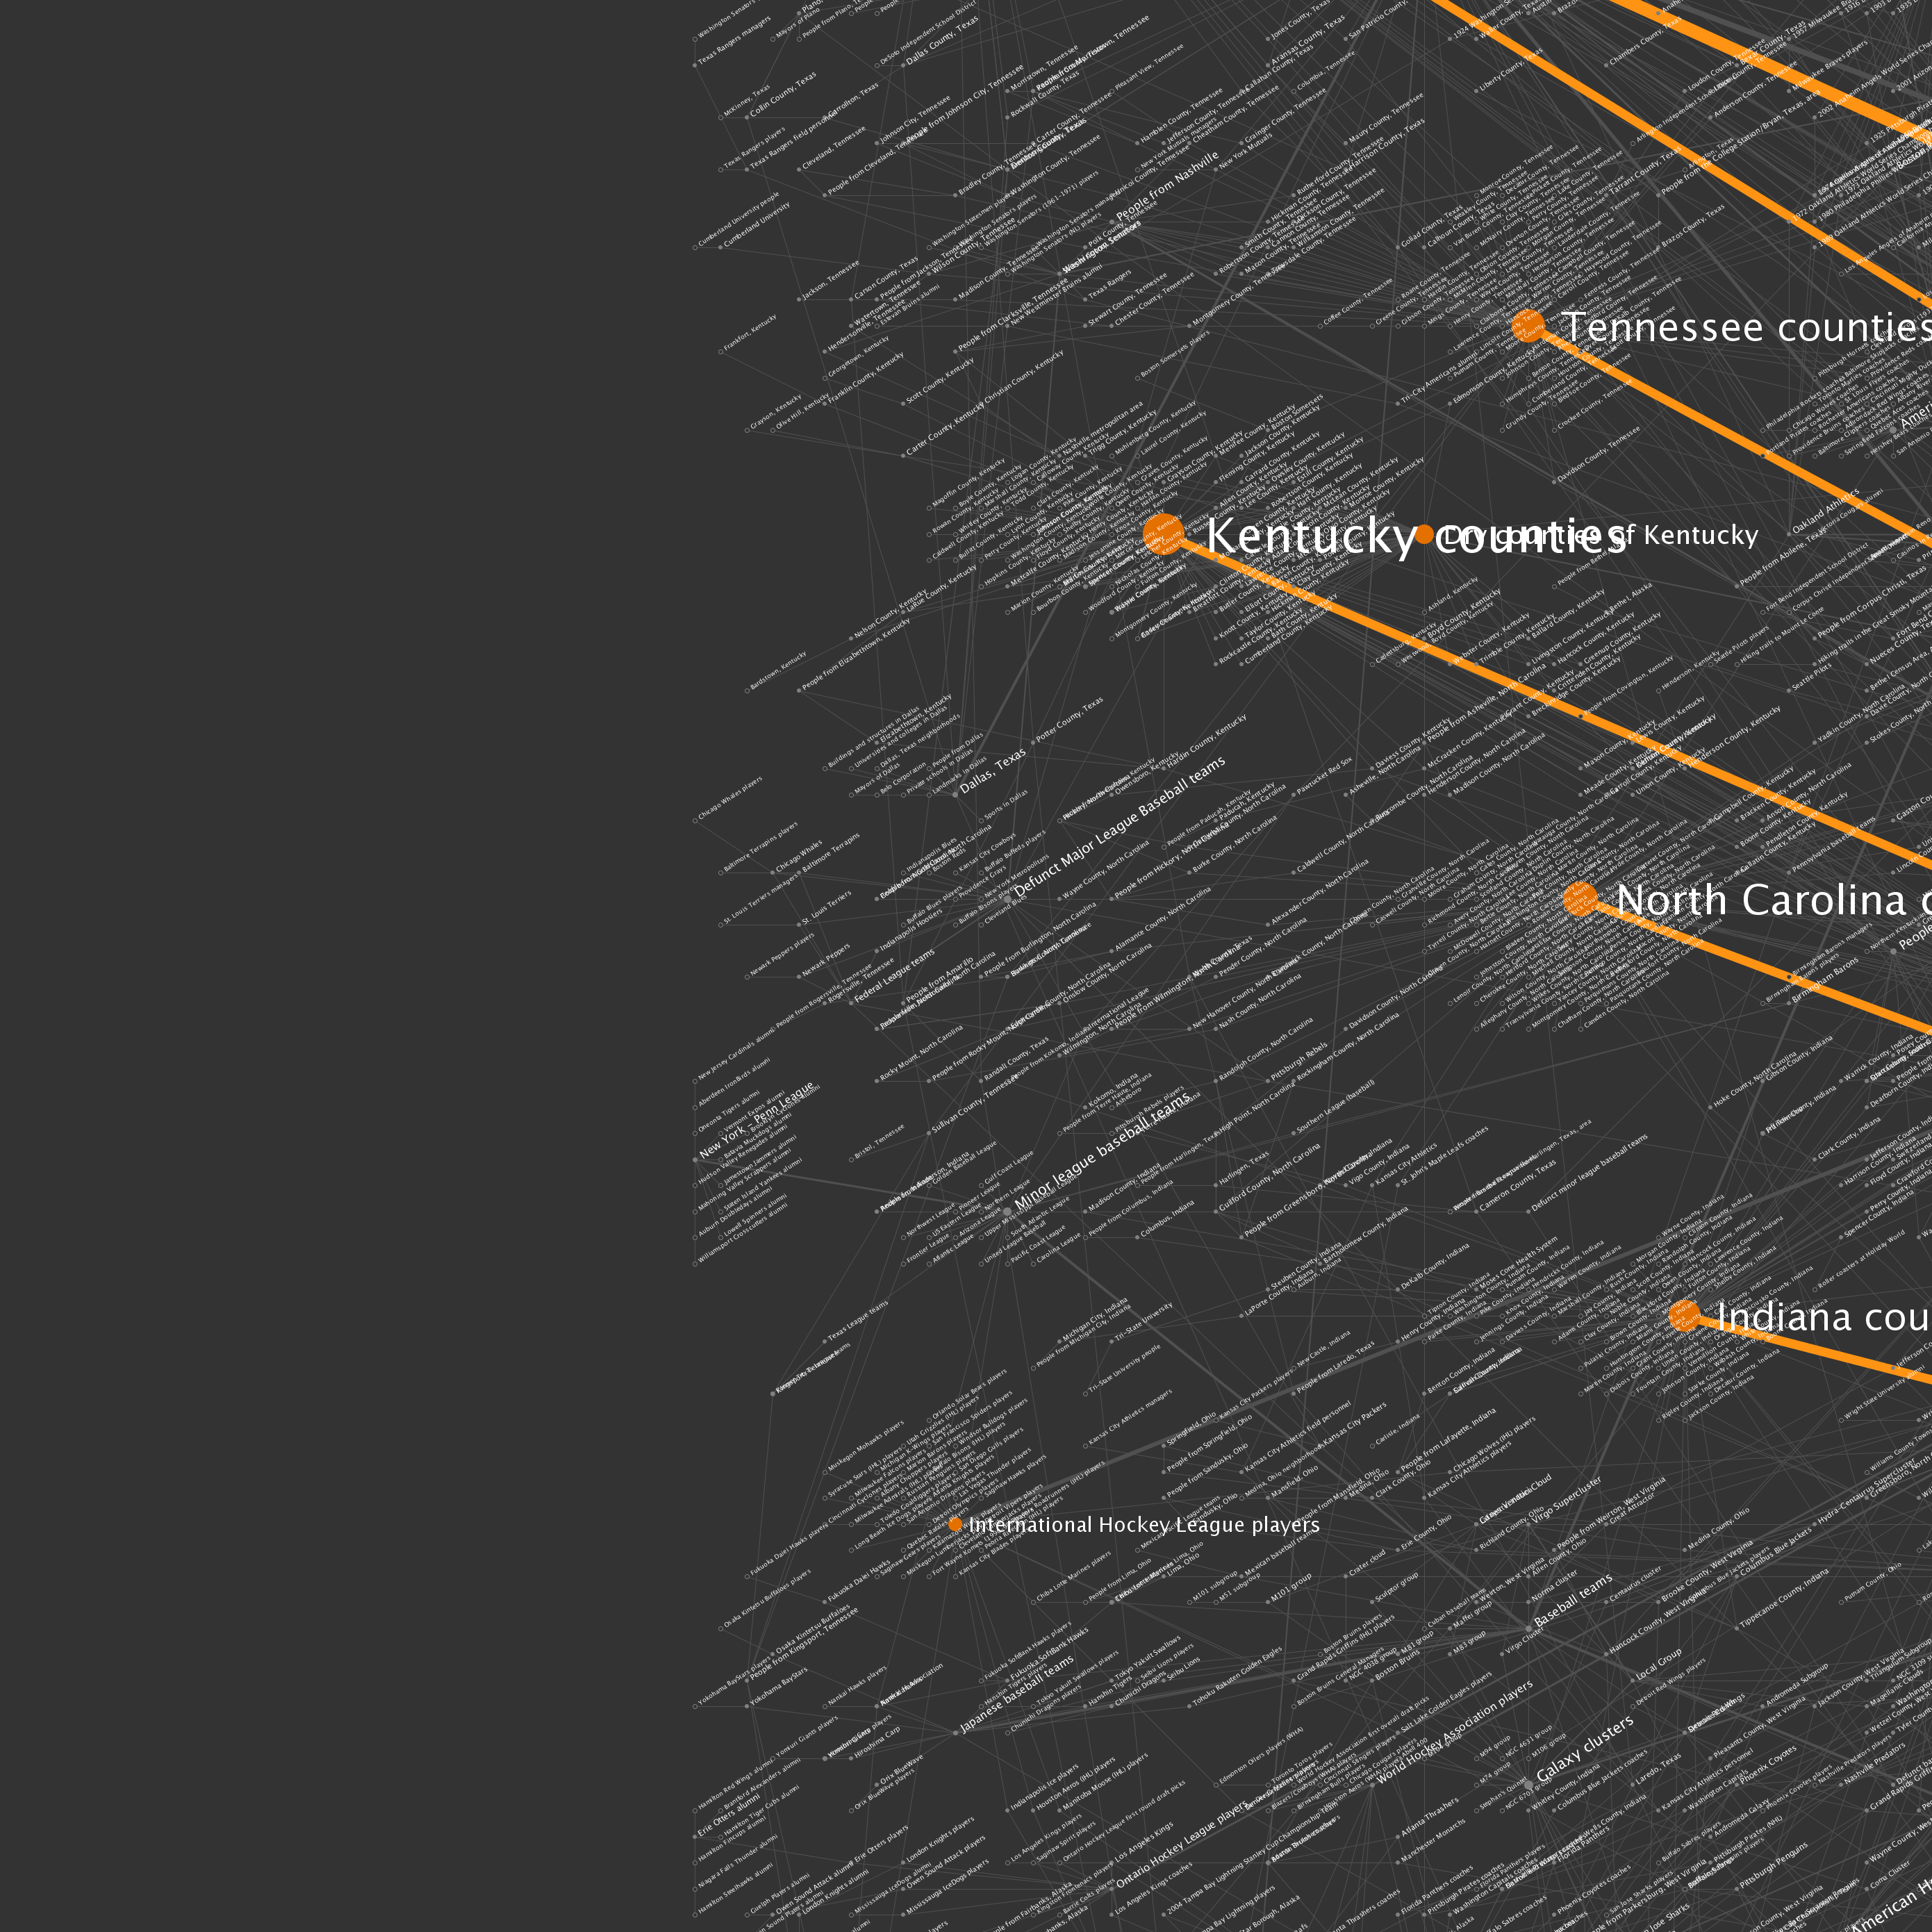
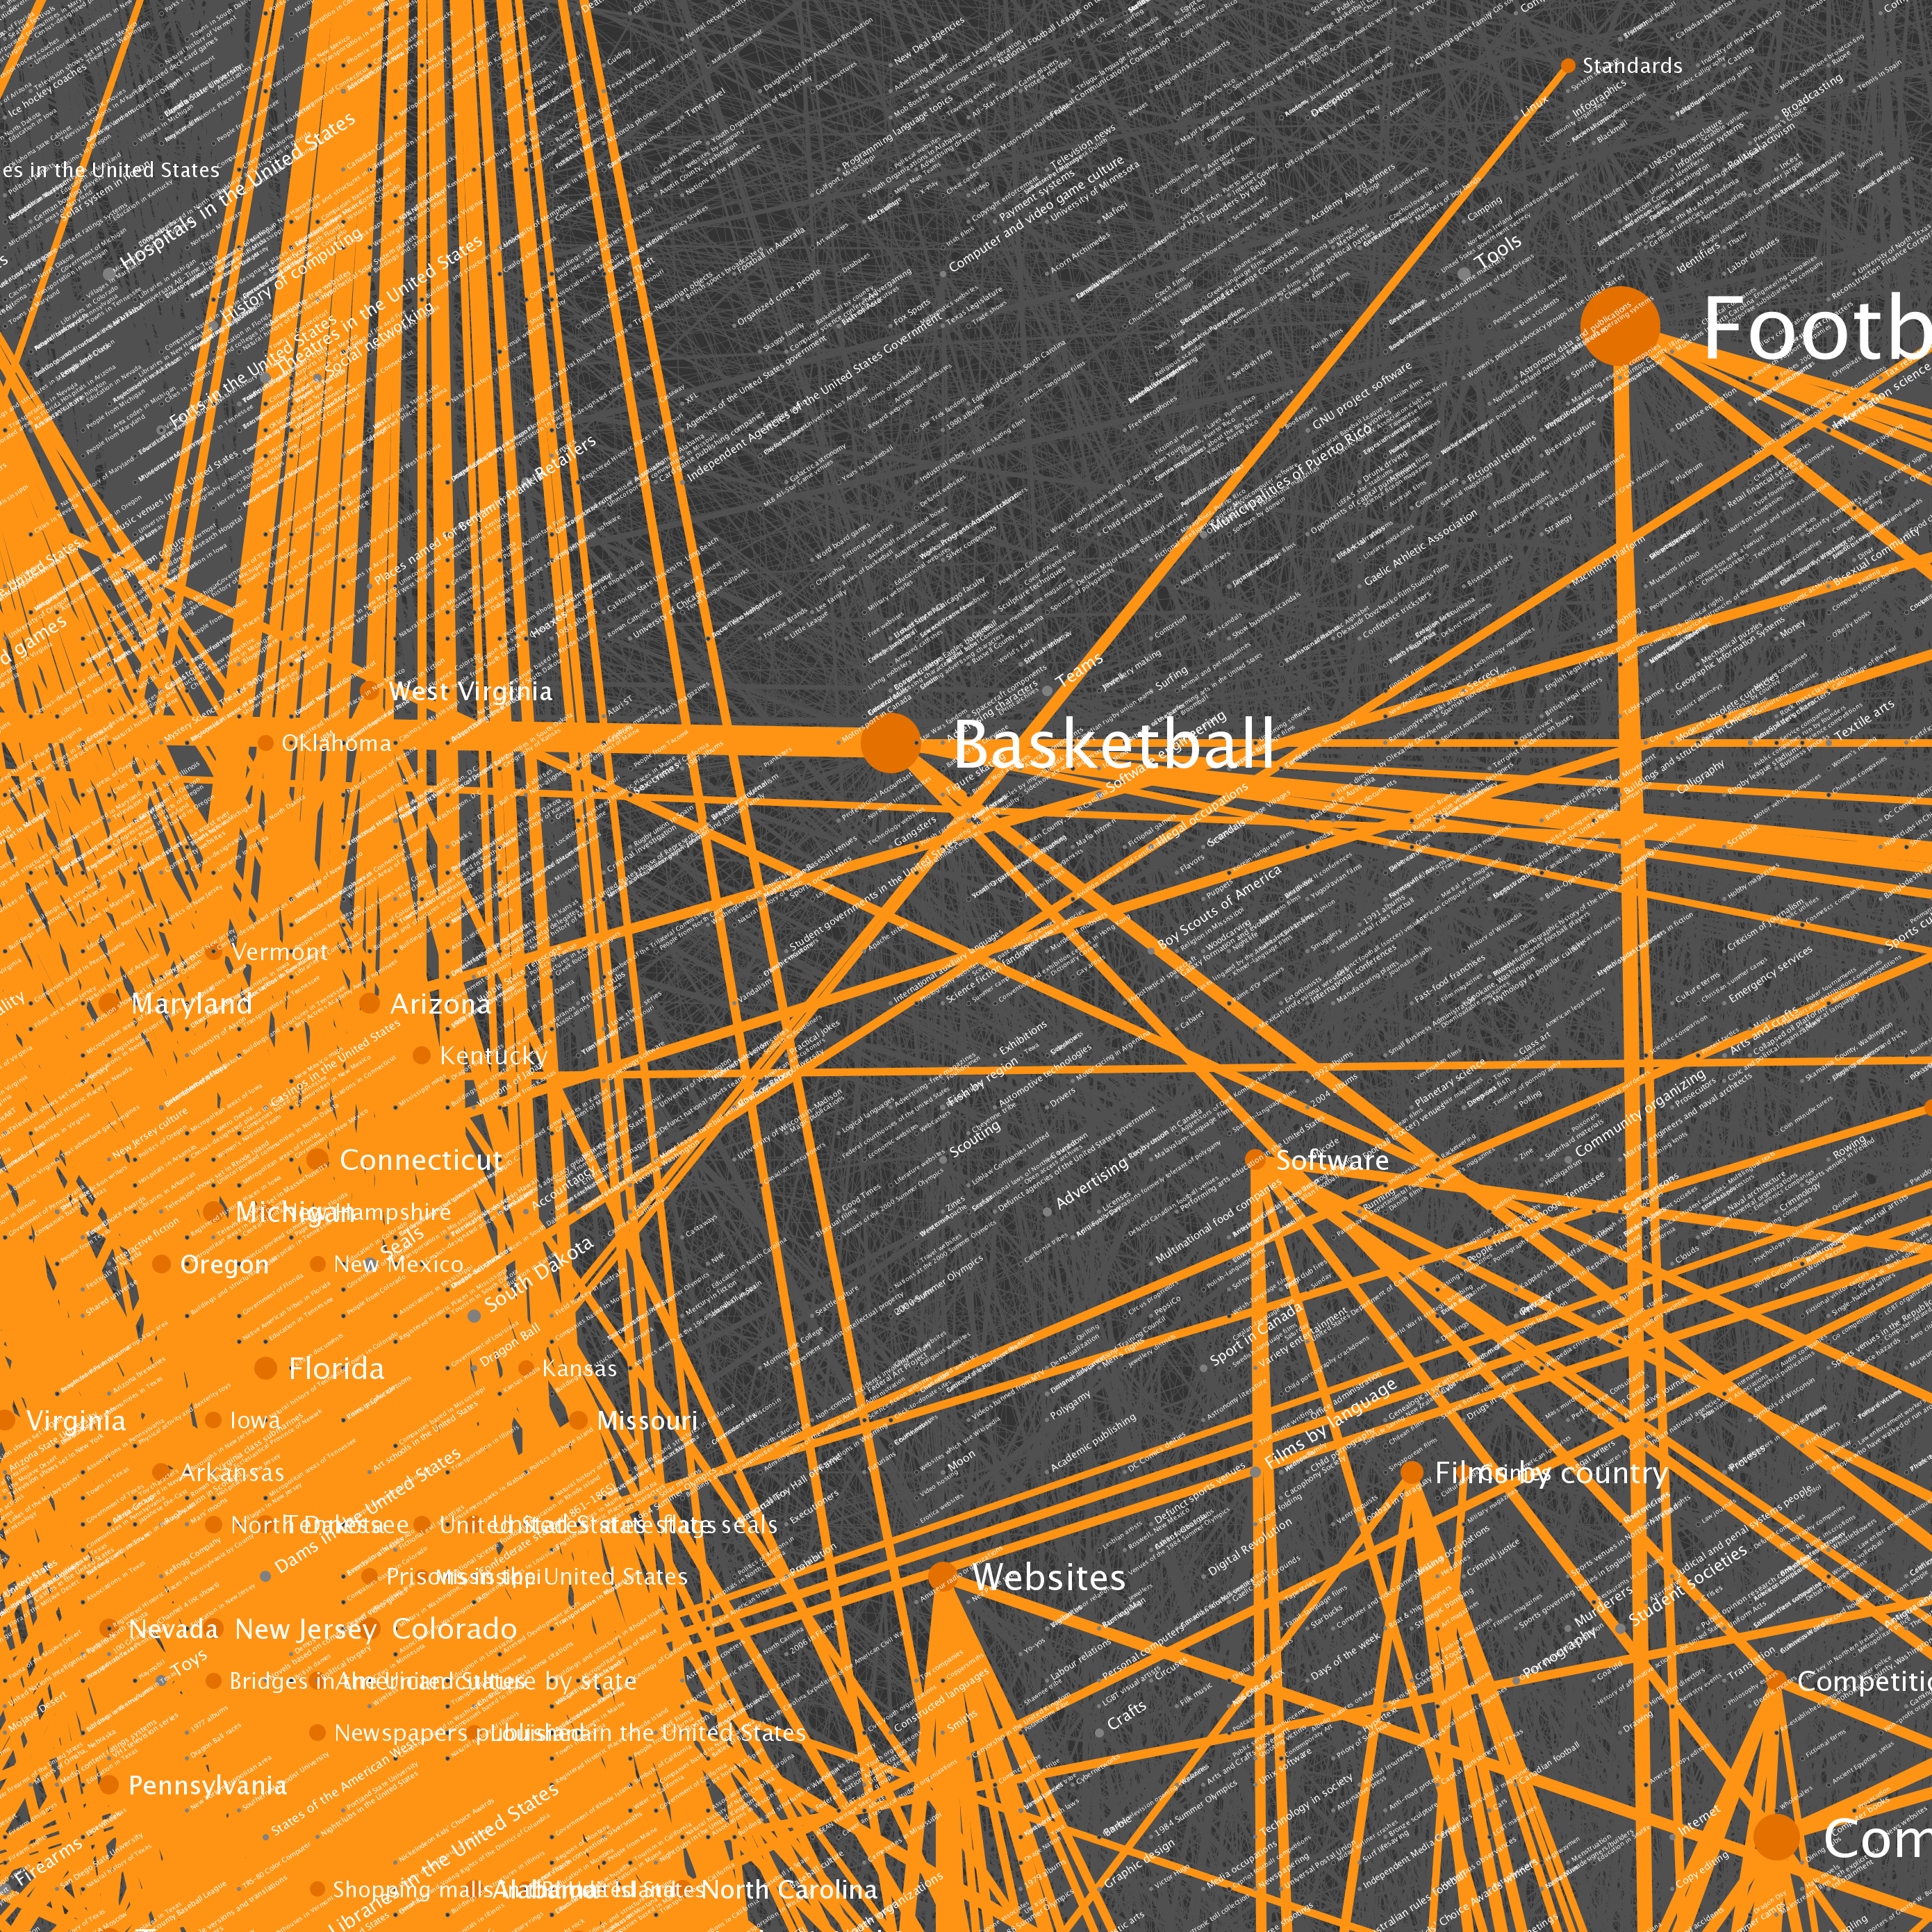
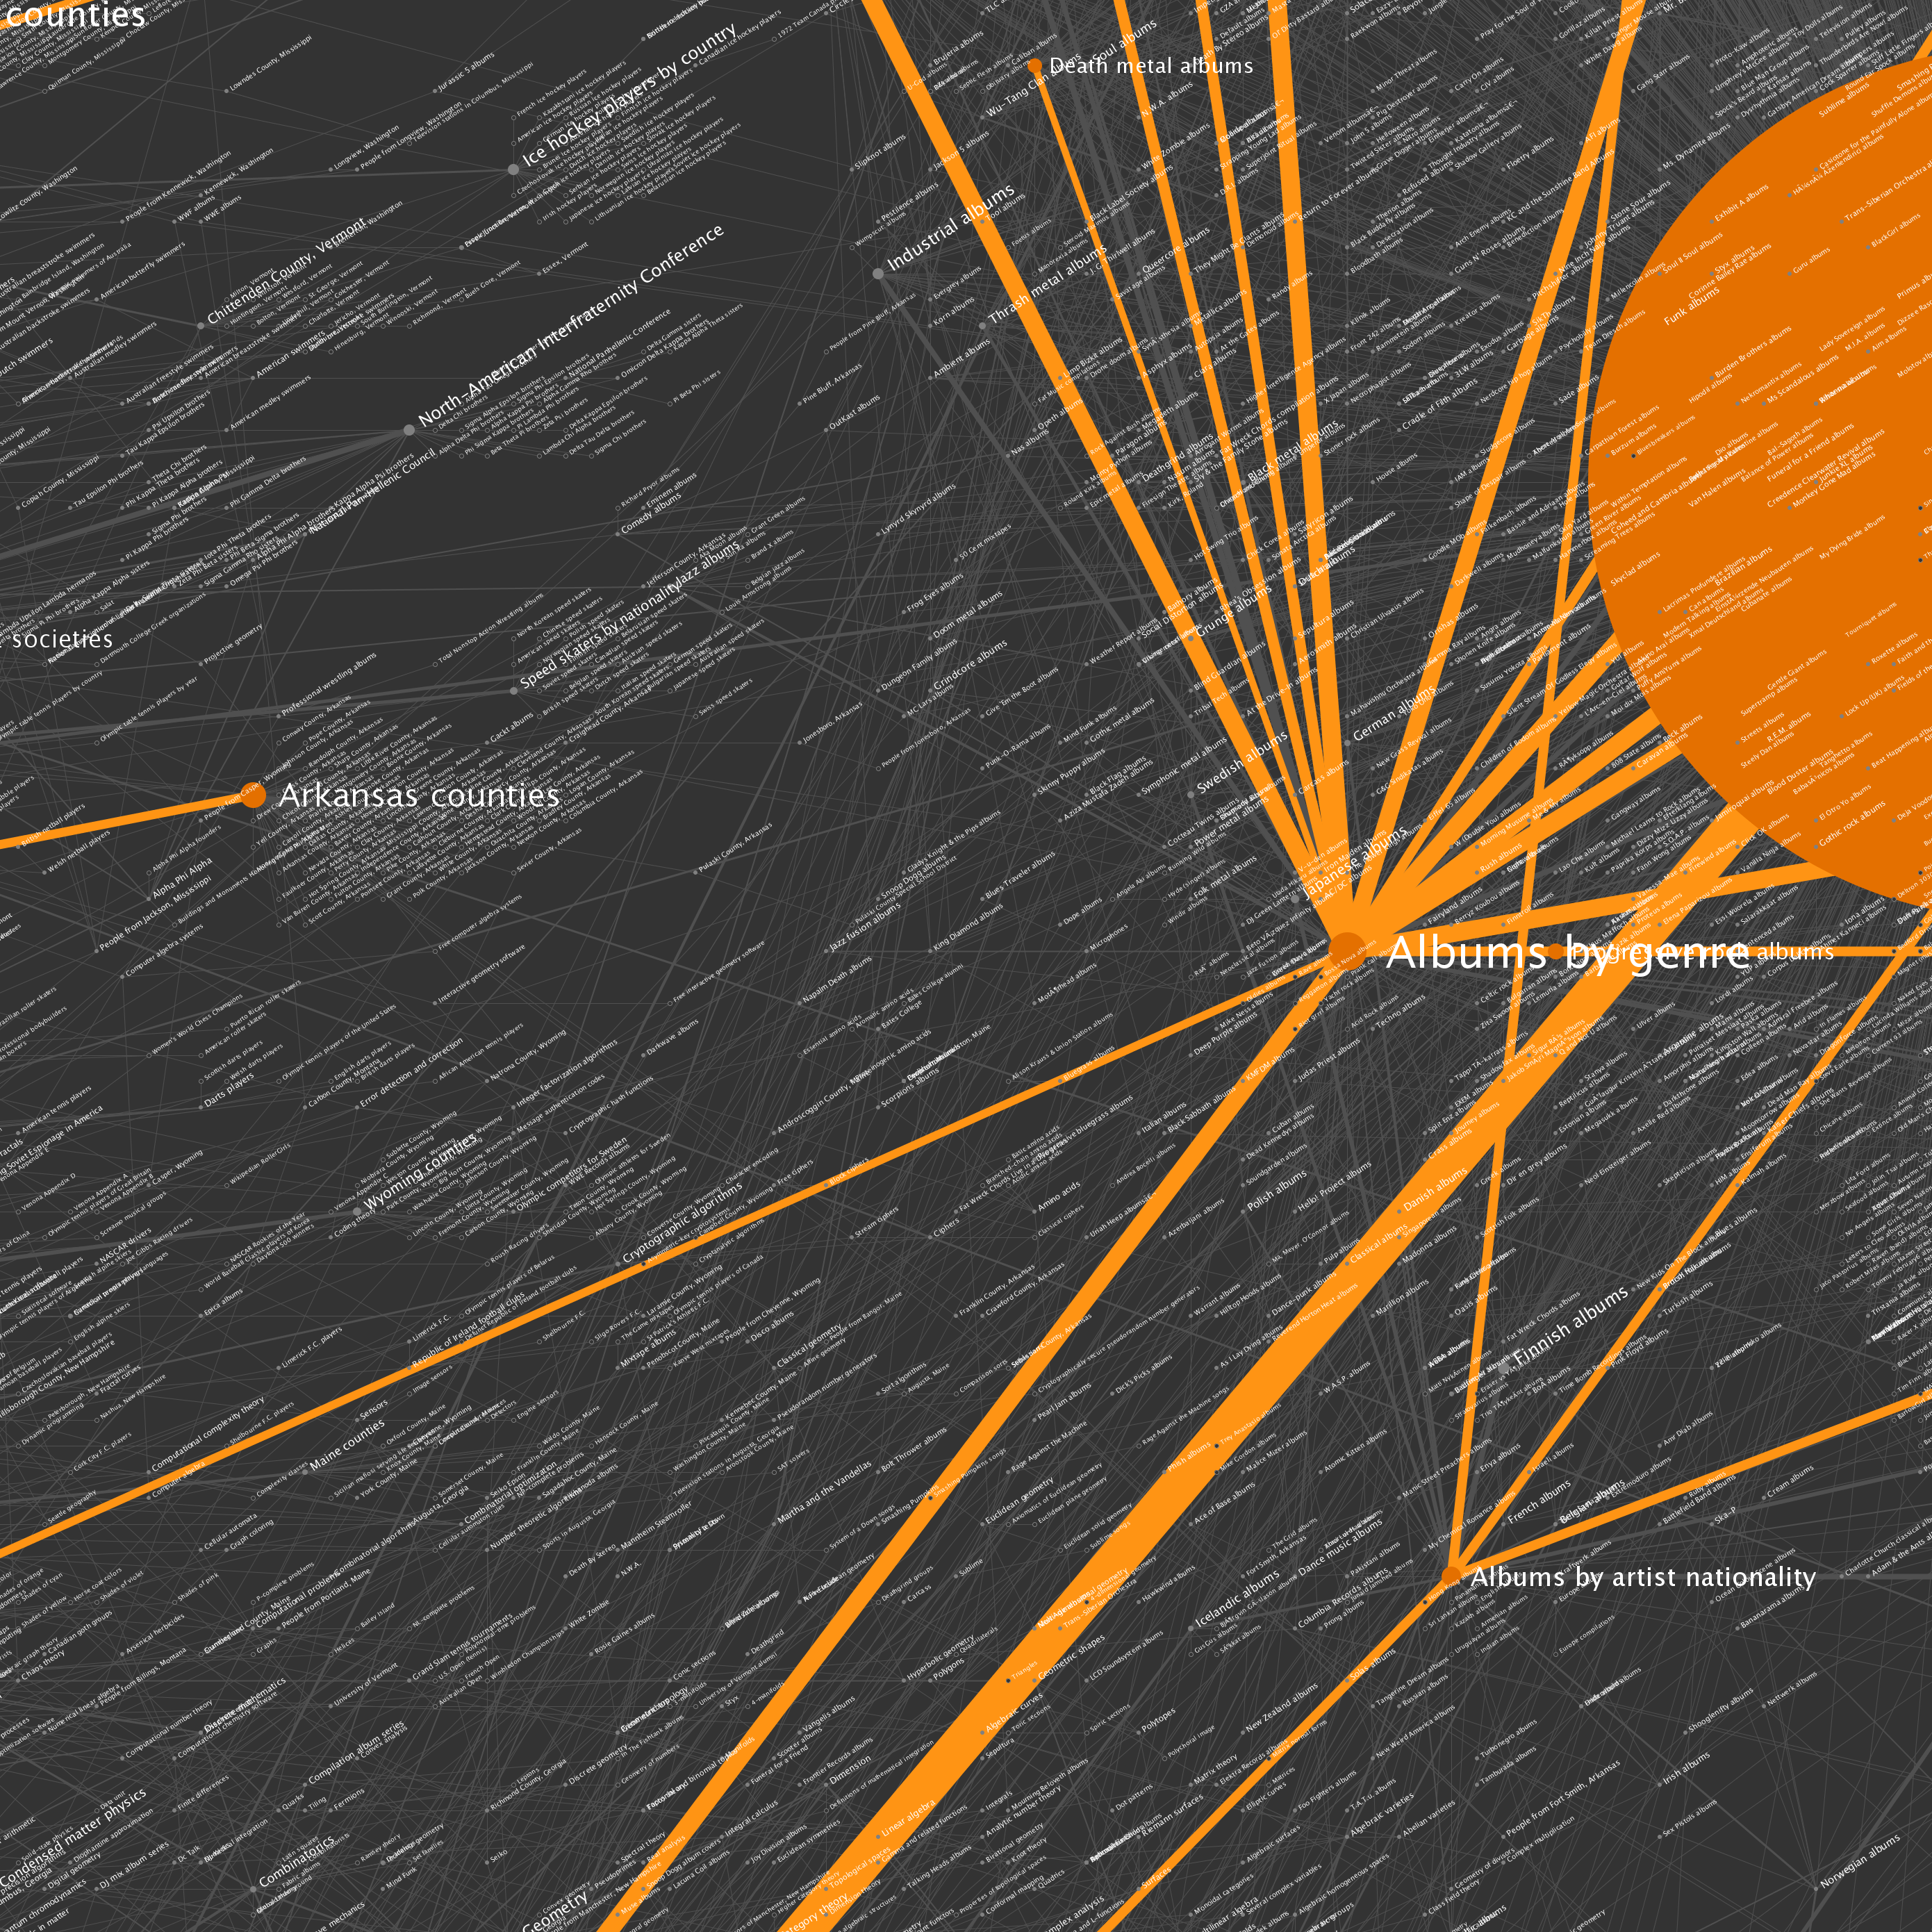
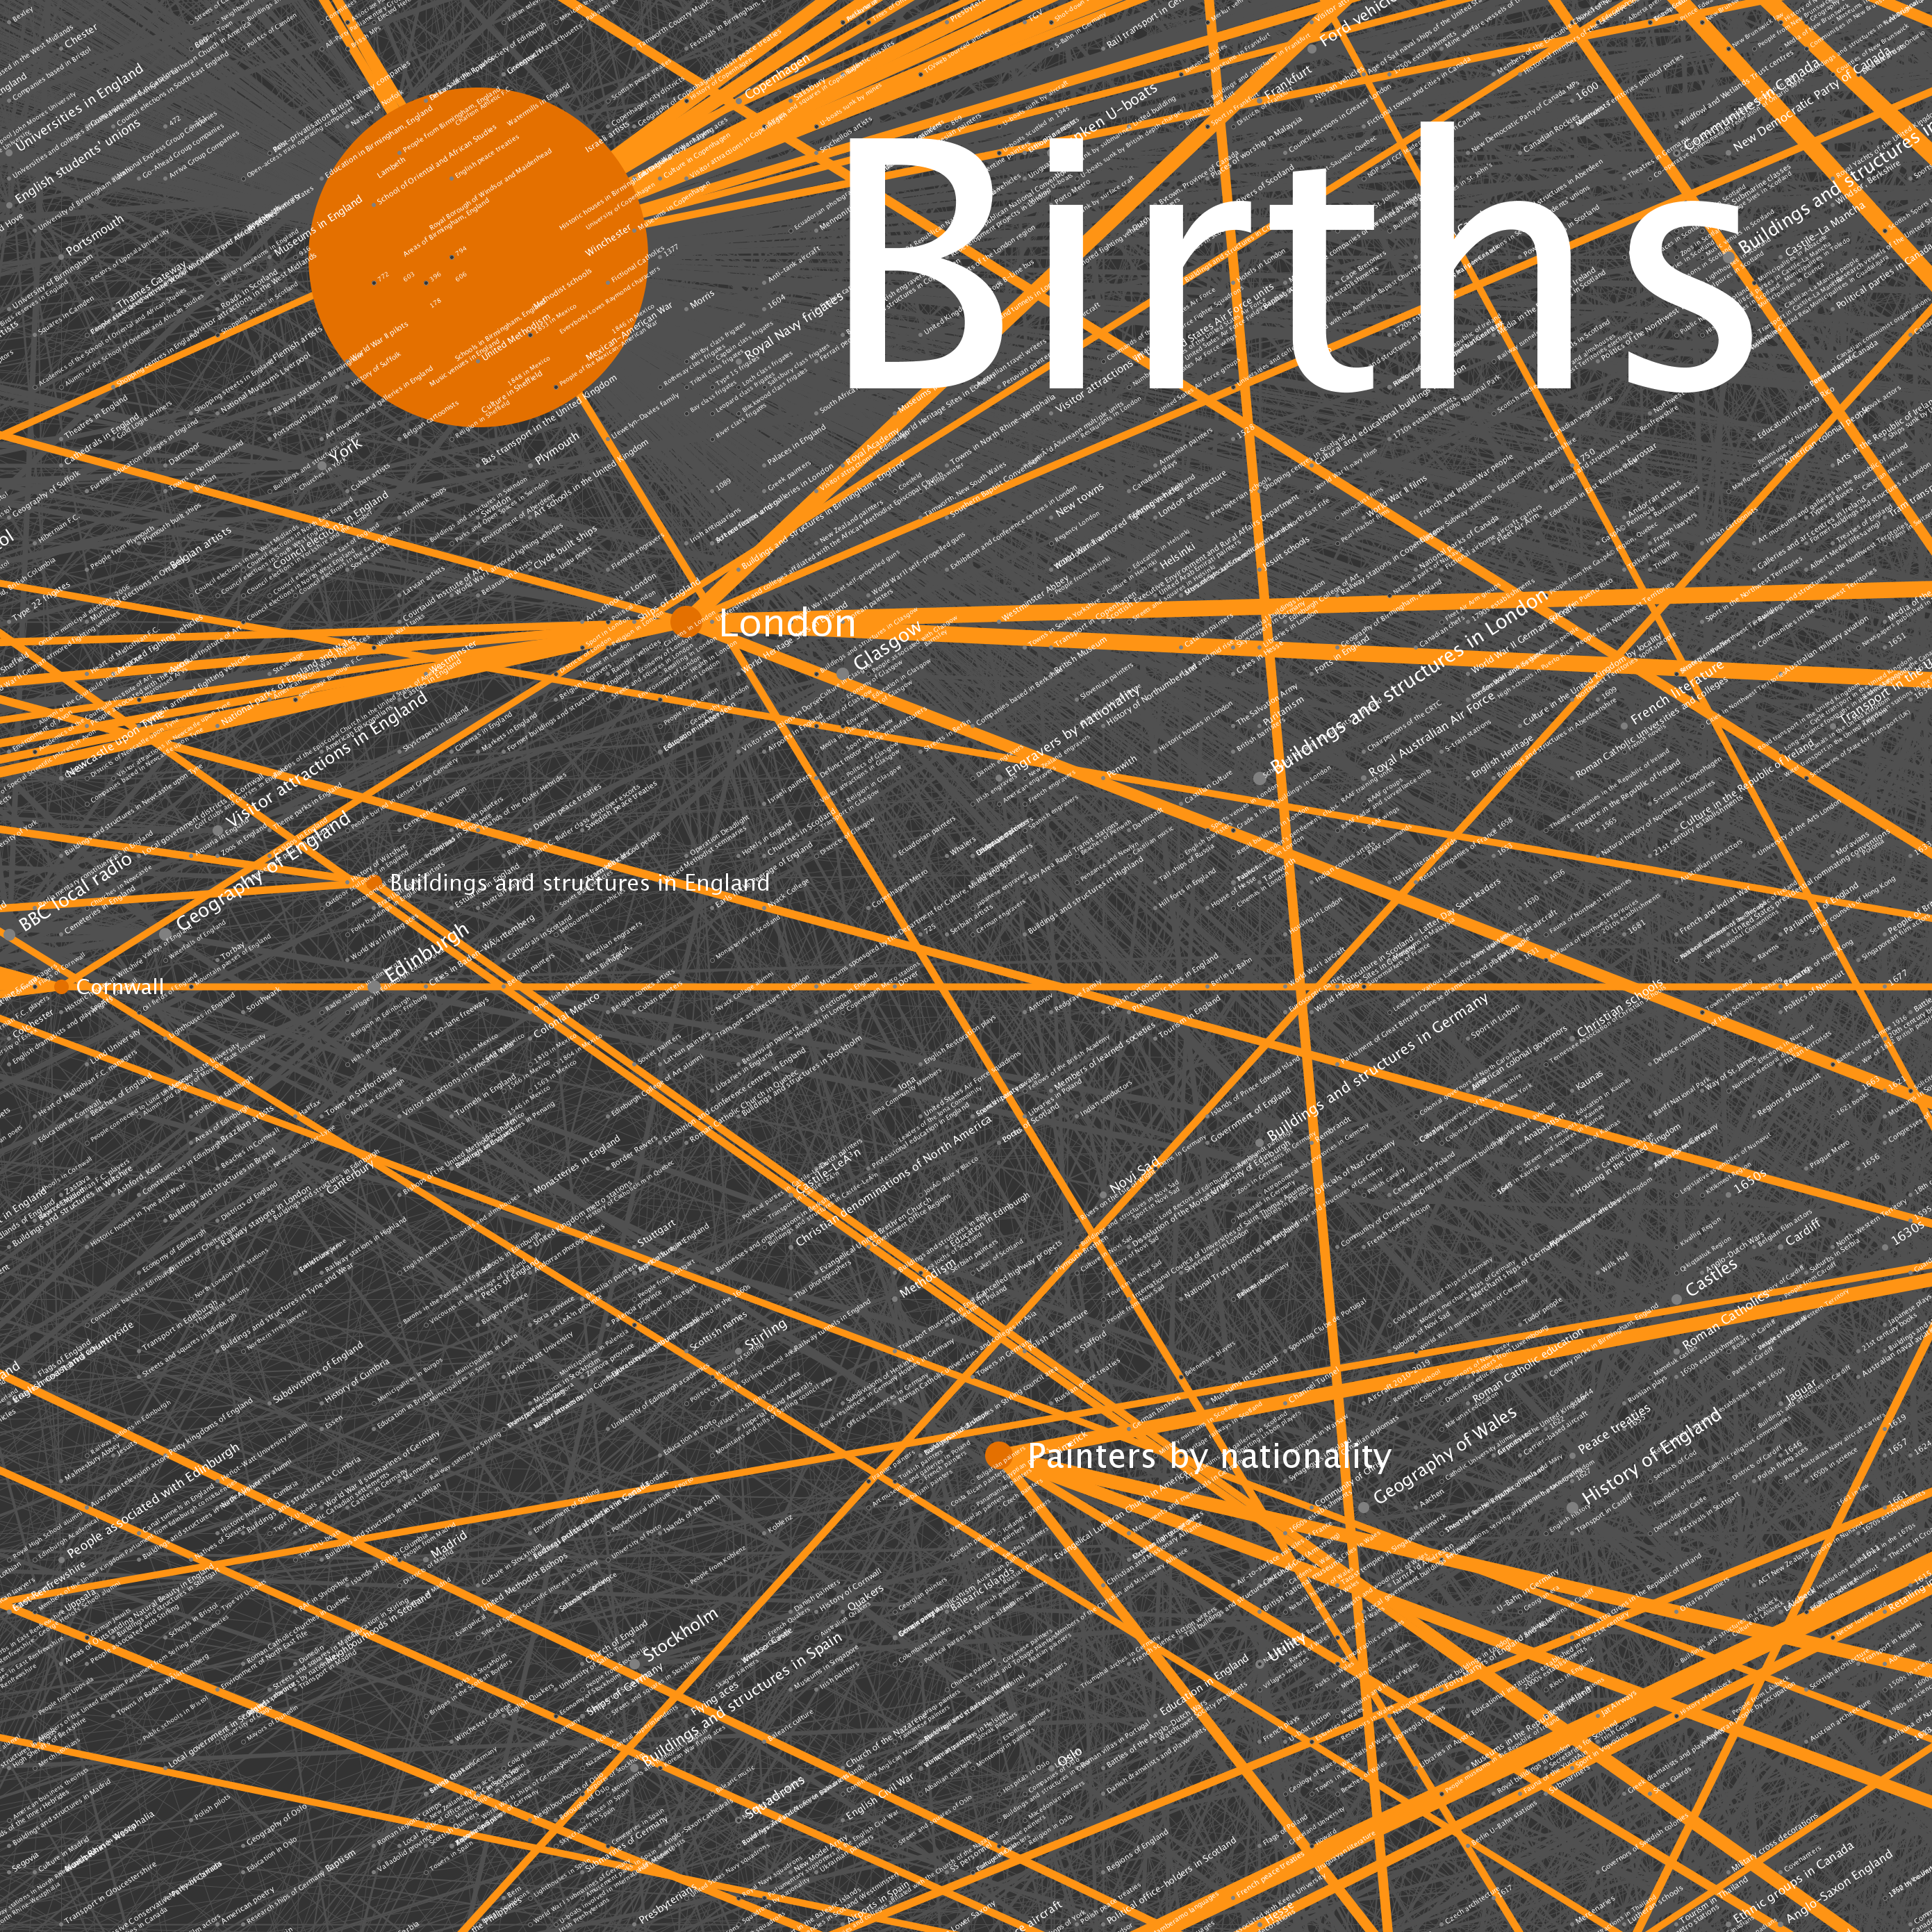
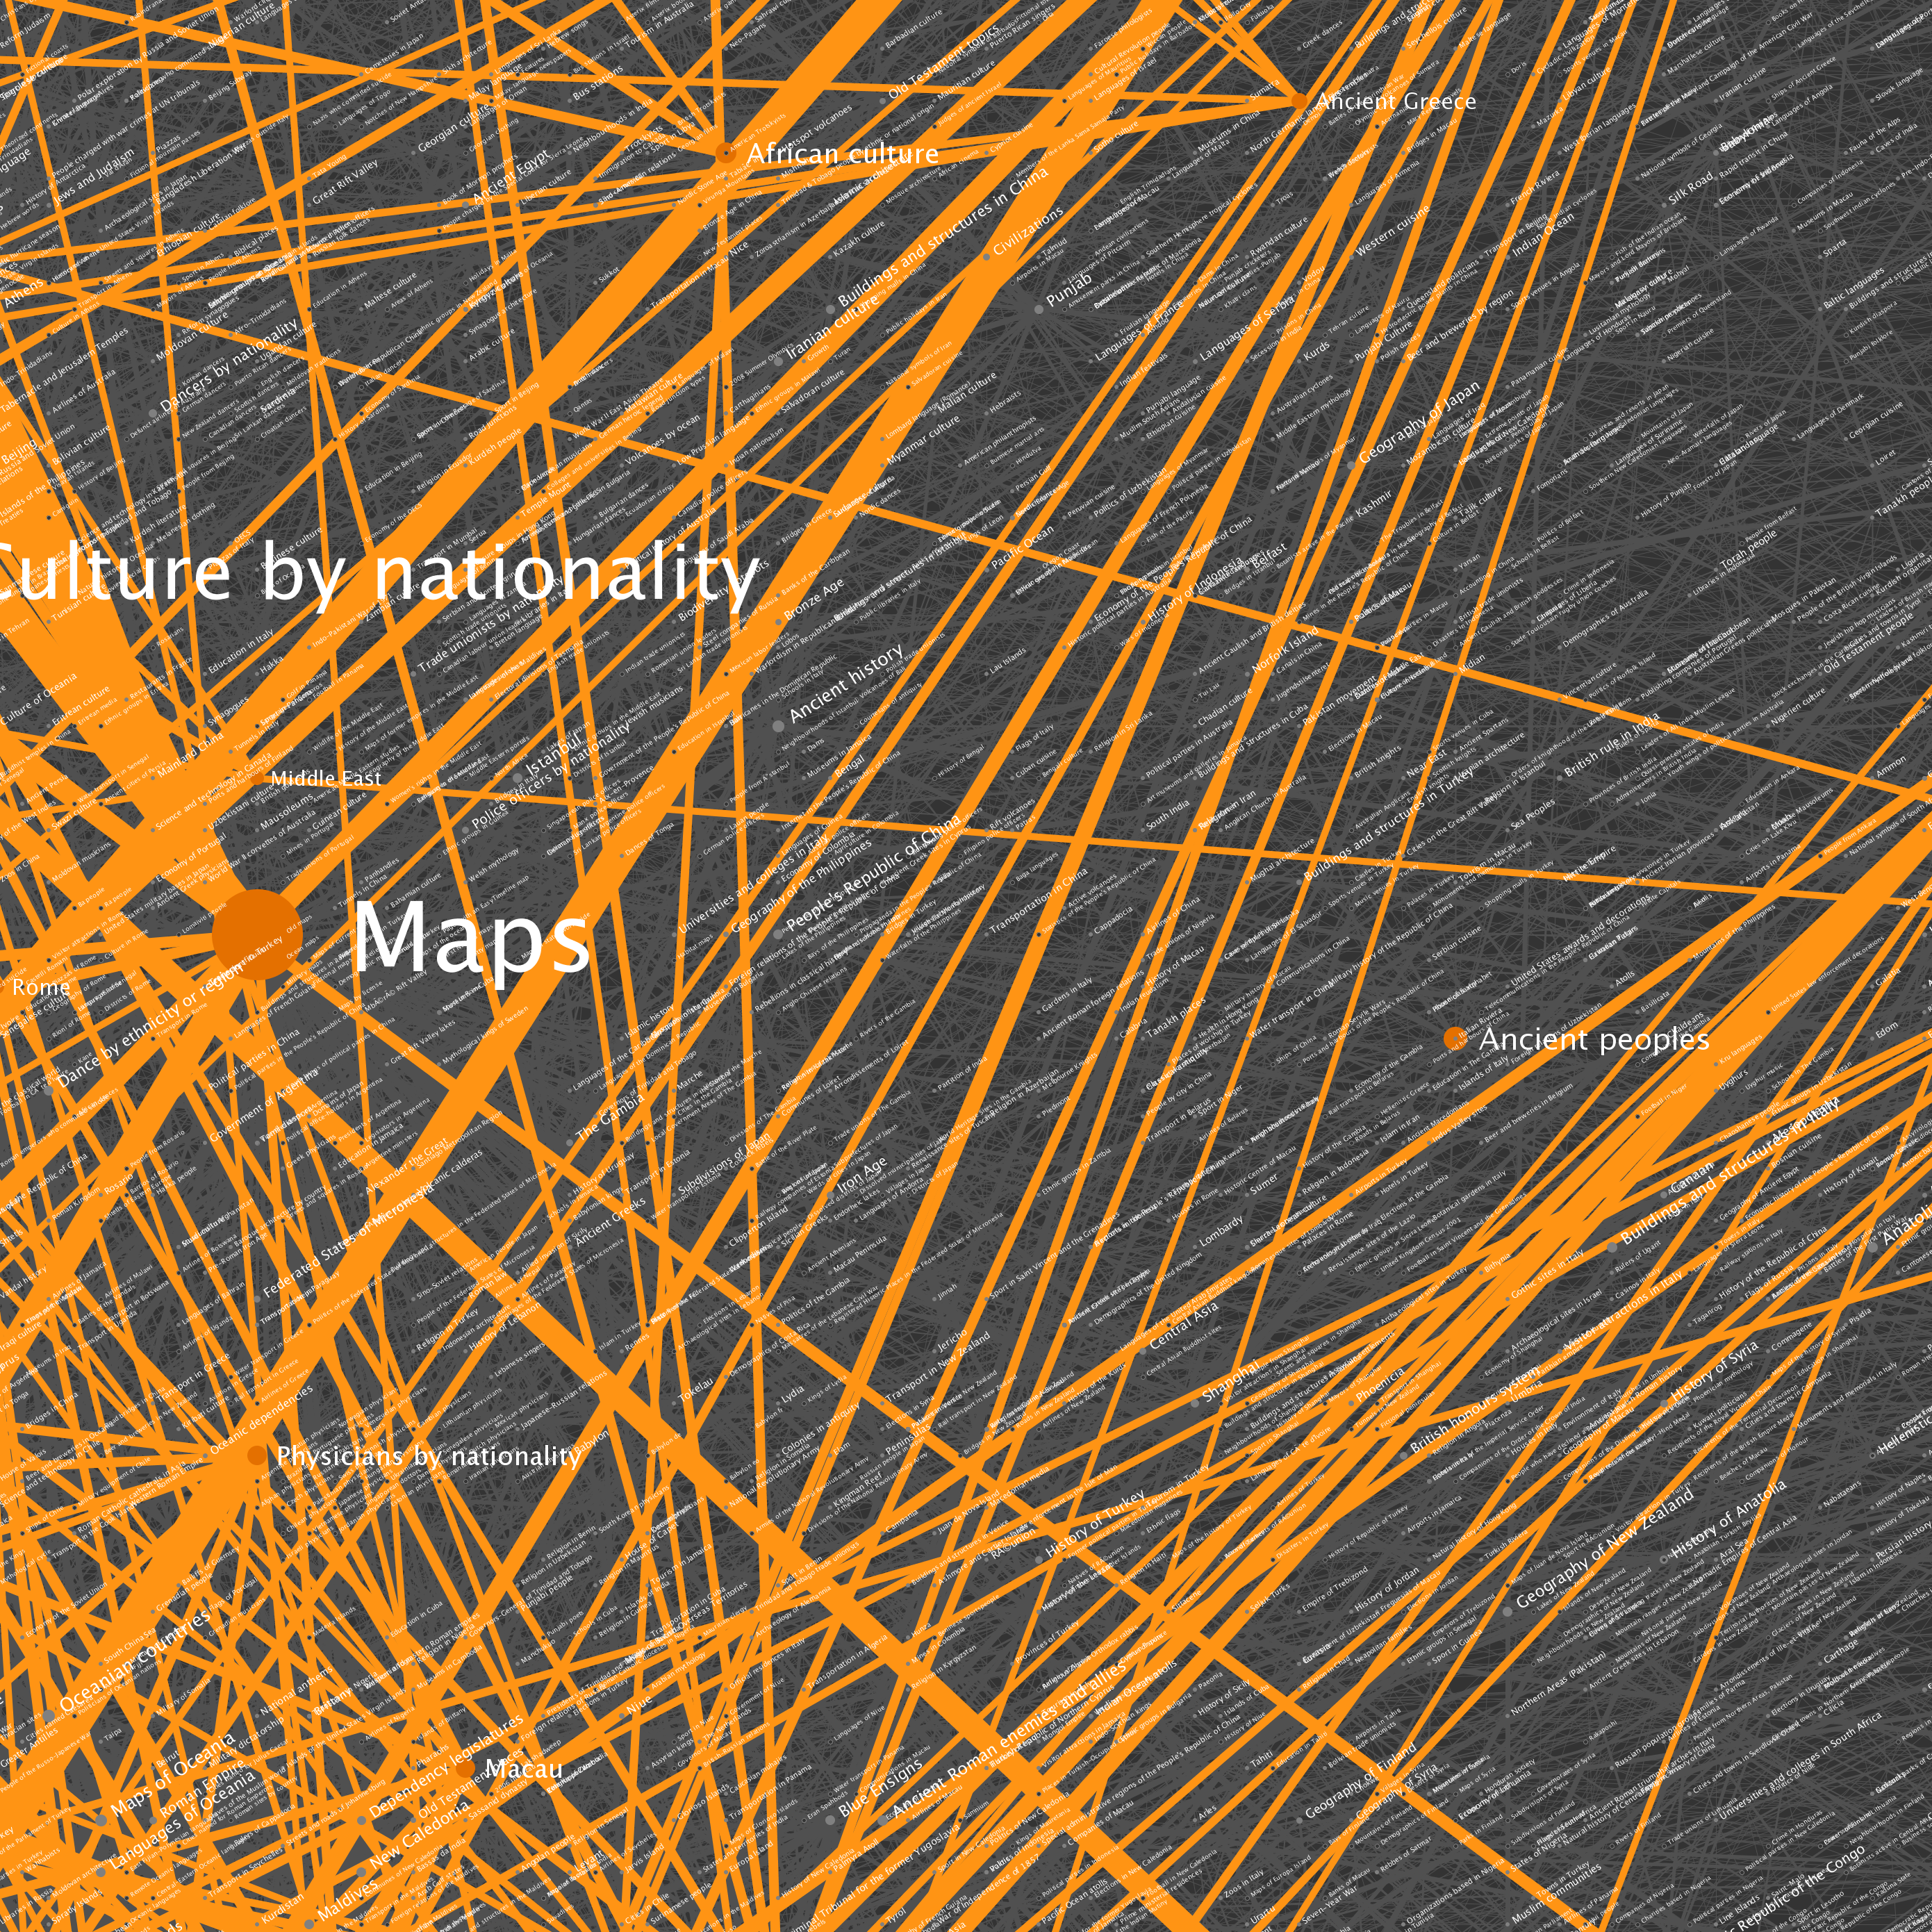
The nodes seen in the graph above were selected by starting at Wikipedia’s Science category page, and traversing category links to a depth of 100 hops. The resulting data included 73,230 category pages (vertices) and more than a quarter of a million links (edges). You can click on any of the tiles to see full resolution versions. I've included some example locations that can be used as starting points.
| Location | Description |
| B6 | A highly connected set of British cities and associated items |
| E6, F6 and around | Countries of the world |
| D6 | Year categories from roughly 1600-2007 |
| D2, D3 and around | U.S. States |
| E2 and F2 | Sports |
| Left side | U.S. Counties |
| Upper right | Cluster of music album categories |
WikiViz v1 to v4
Below are some visualizations that have been produced. Various layout duration and spring attributes were used. Beware of the high resolution links. Some JPEGs are 30+ MB, which can seriously tax your hardware.
 | \\  |
| Two levels deep, centered on History (WikiViz v4). | Four levels deep, centered on Mathematics (WikiViz v3) |
 |  |
| Three levels deep, centered on Physics (WikiViz v3) | Five levels deep, centered on History (WikiViz v3) |
 |  |
| Four levels deep, centered on Politics (WikiViz v3) | Five levels deep, centered on History (WikiViz v3) |
 |  |
| Three levels deep, centered on Humans (WikiViz v2) | Close up of graph shown at left. |
 |  |
| Three levels deep, centered on Physics (WikiViz v2) | Three levels deep, centered on Math (WikiViz v2) |