ClusterBall
This visualization shows the structure of three levels of Wikipedia category pages and their interconnections. Centered in the graph is a parent node. Pages that are linked from this parent node are rendered inside the ball. Finally, pages that are linked to the latter (secondary) nodes are rendered on the outer ring. Links between category pages are illustrated by edges, which are color coded to represent their depth from the parent node. Nodes are clustered such that edge lengths are minimized. This forces highly connected groups of pages to clump together, essentially forming topical groups. The center acts as an anchor while the ring provides a fixed perimeter. This allows the secondary, super-categories to "float" above clusters.
 Movement of Third level (Outer) Connections (see movie) |  Movement of Second Level (Middle) Connections (see movie) |
The clustering component of this visualization is vital. The mere presence of information isn't all that interesting; there is no context or relevance to be gleaned. However, the structure of information is revealing about where fields intersect and diverge, and ultimately about how humans organize information. MVblogosphere, 6Bone IPv6, and Gnom are similar in style, but structure is hard or impossible to derive. See my previous Wikipedia visualization project for additional motivation details.
I'm exploring if the clustering method is novel, and whether a publication is in order. I've provided a series of movies that show how nodes are sorted into a near-optimal state. Each frame is a single iteration of the algorithm (slowed to 15 FPS). To give you some idea of algorithmic complexity, the renderings included on this page took less than a second to layout.
Sample Renderings
 | 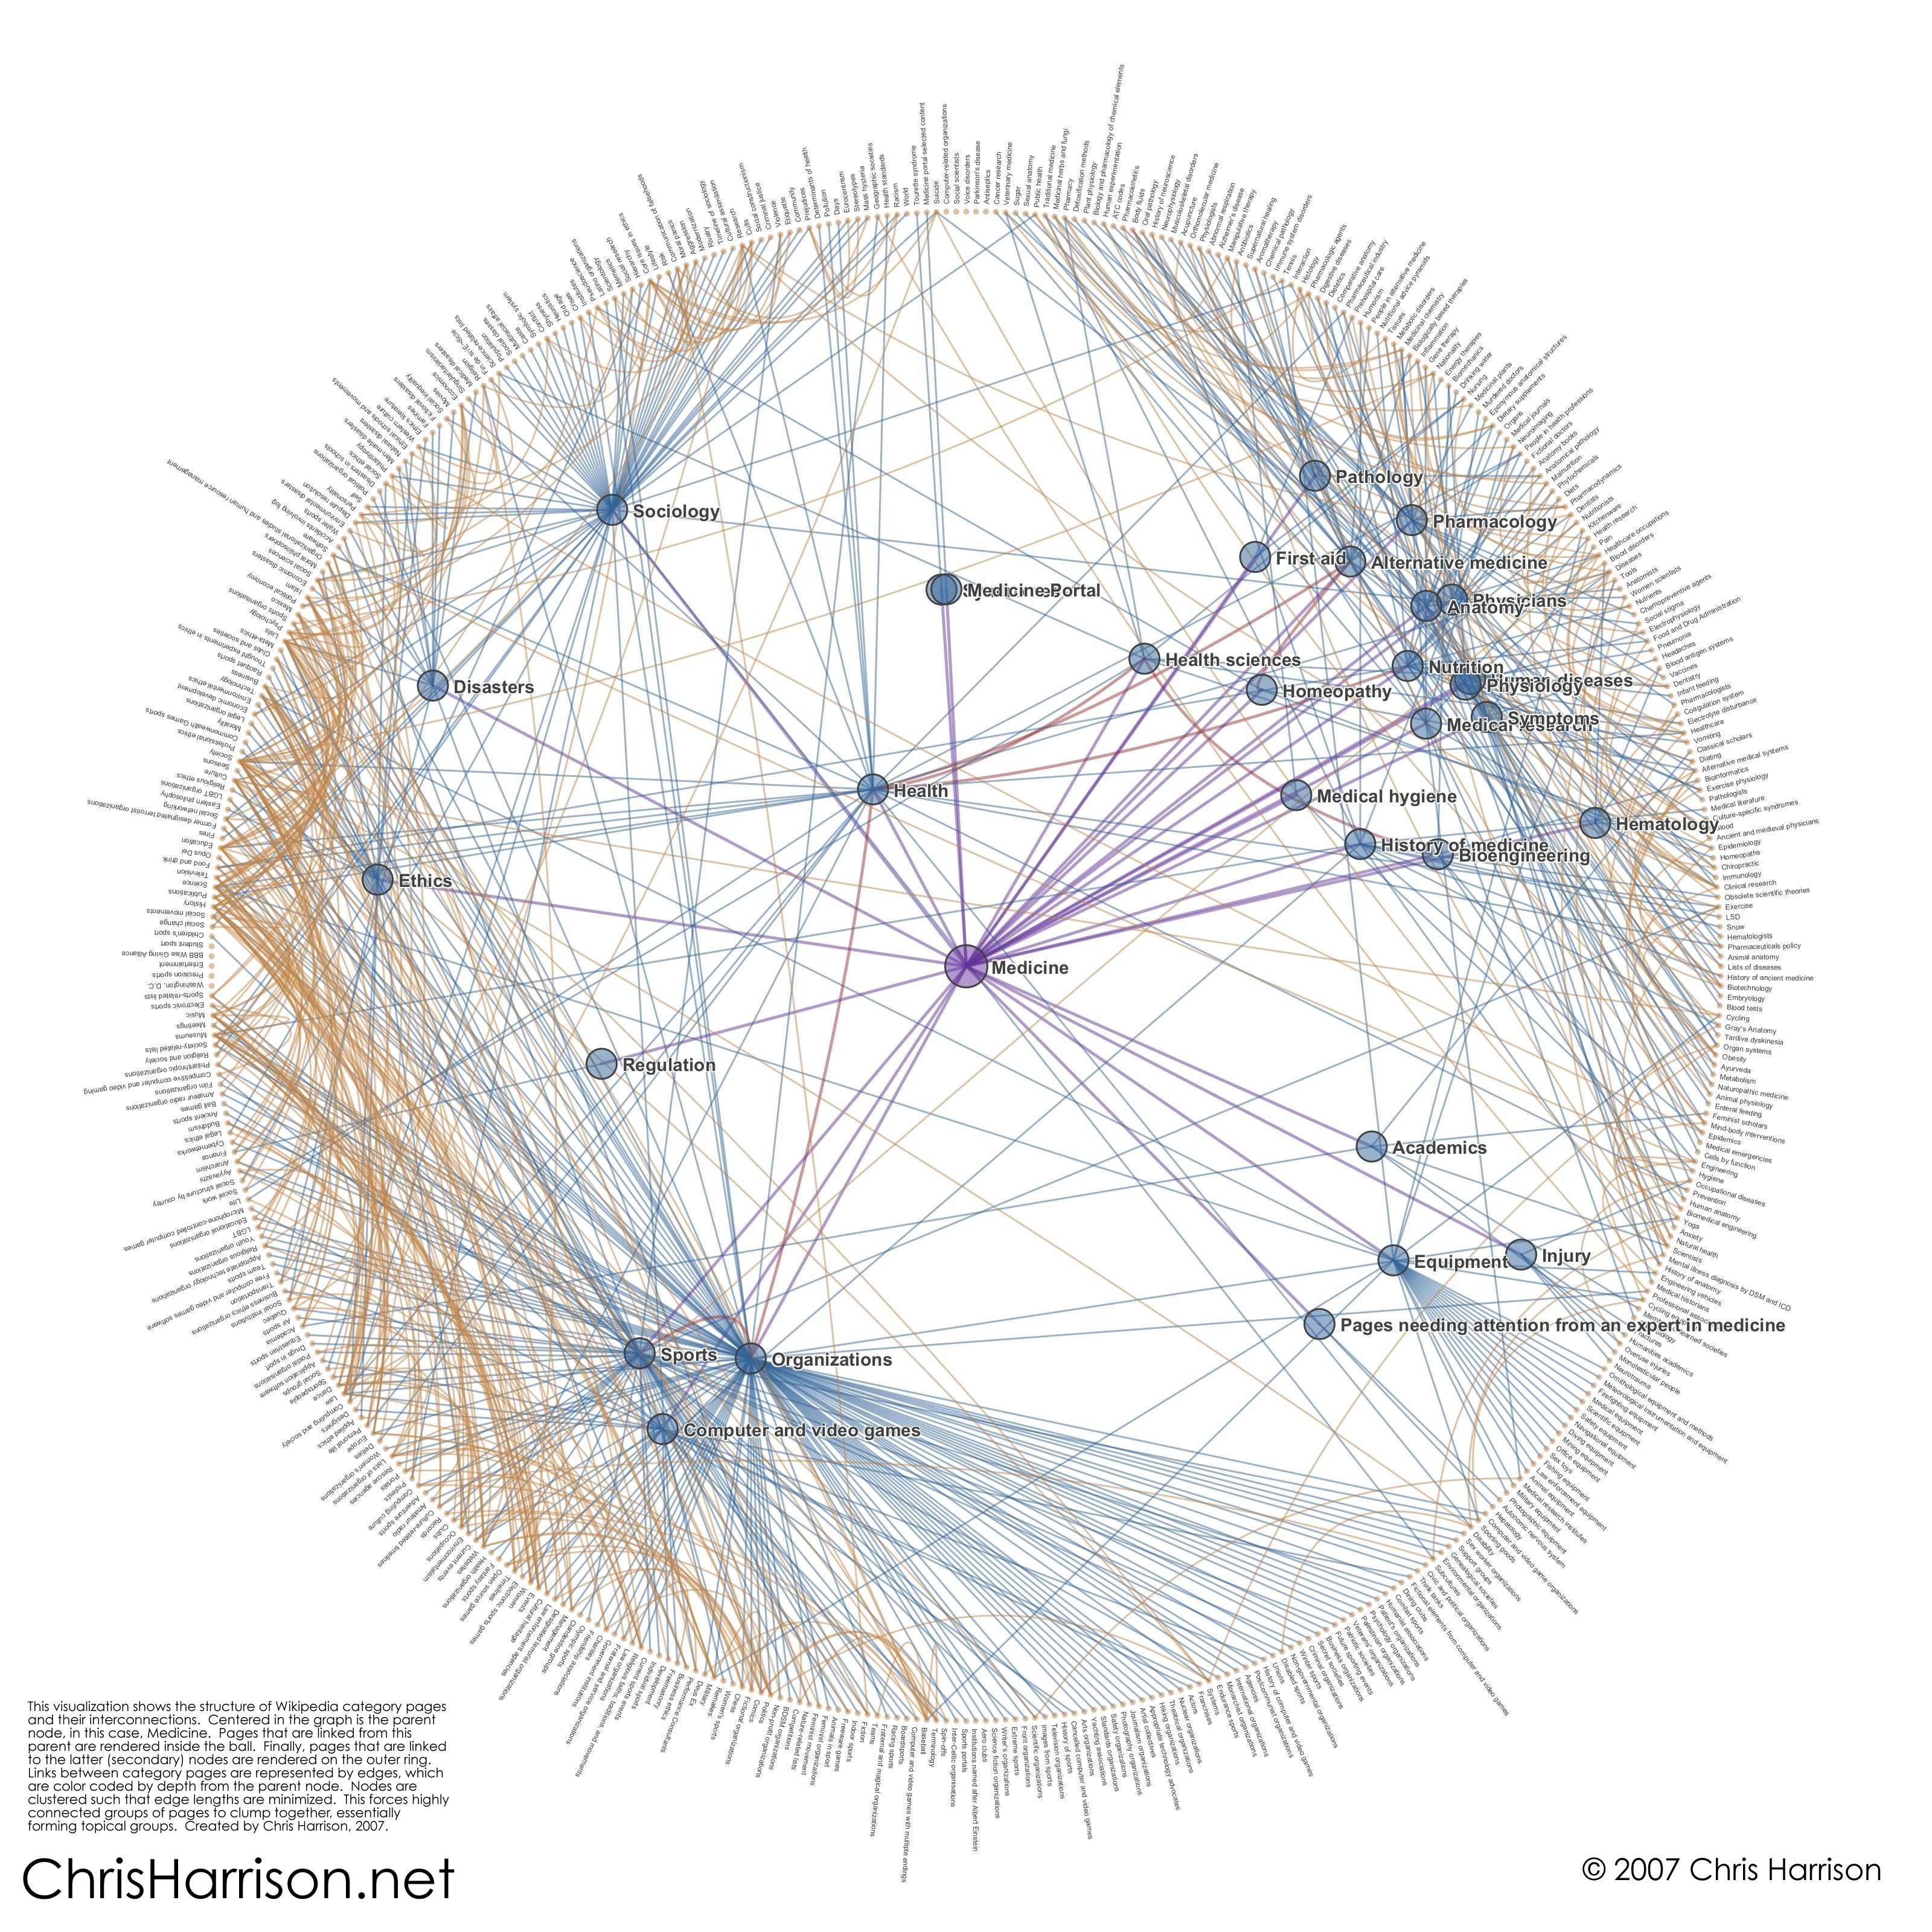 |
| Humans | Medicine |
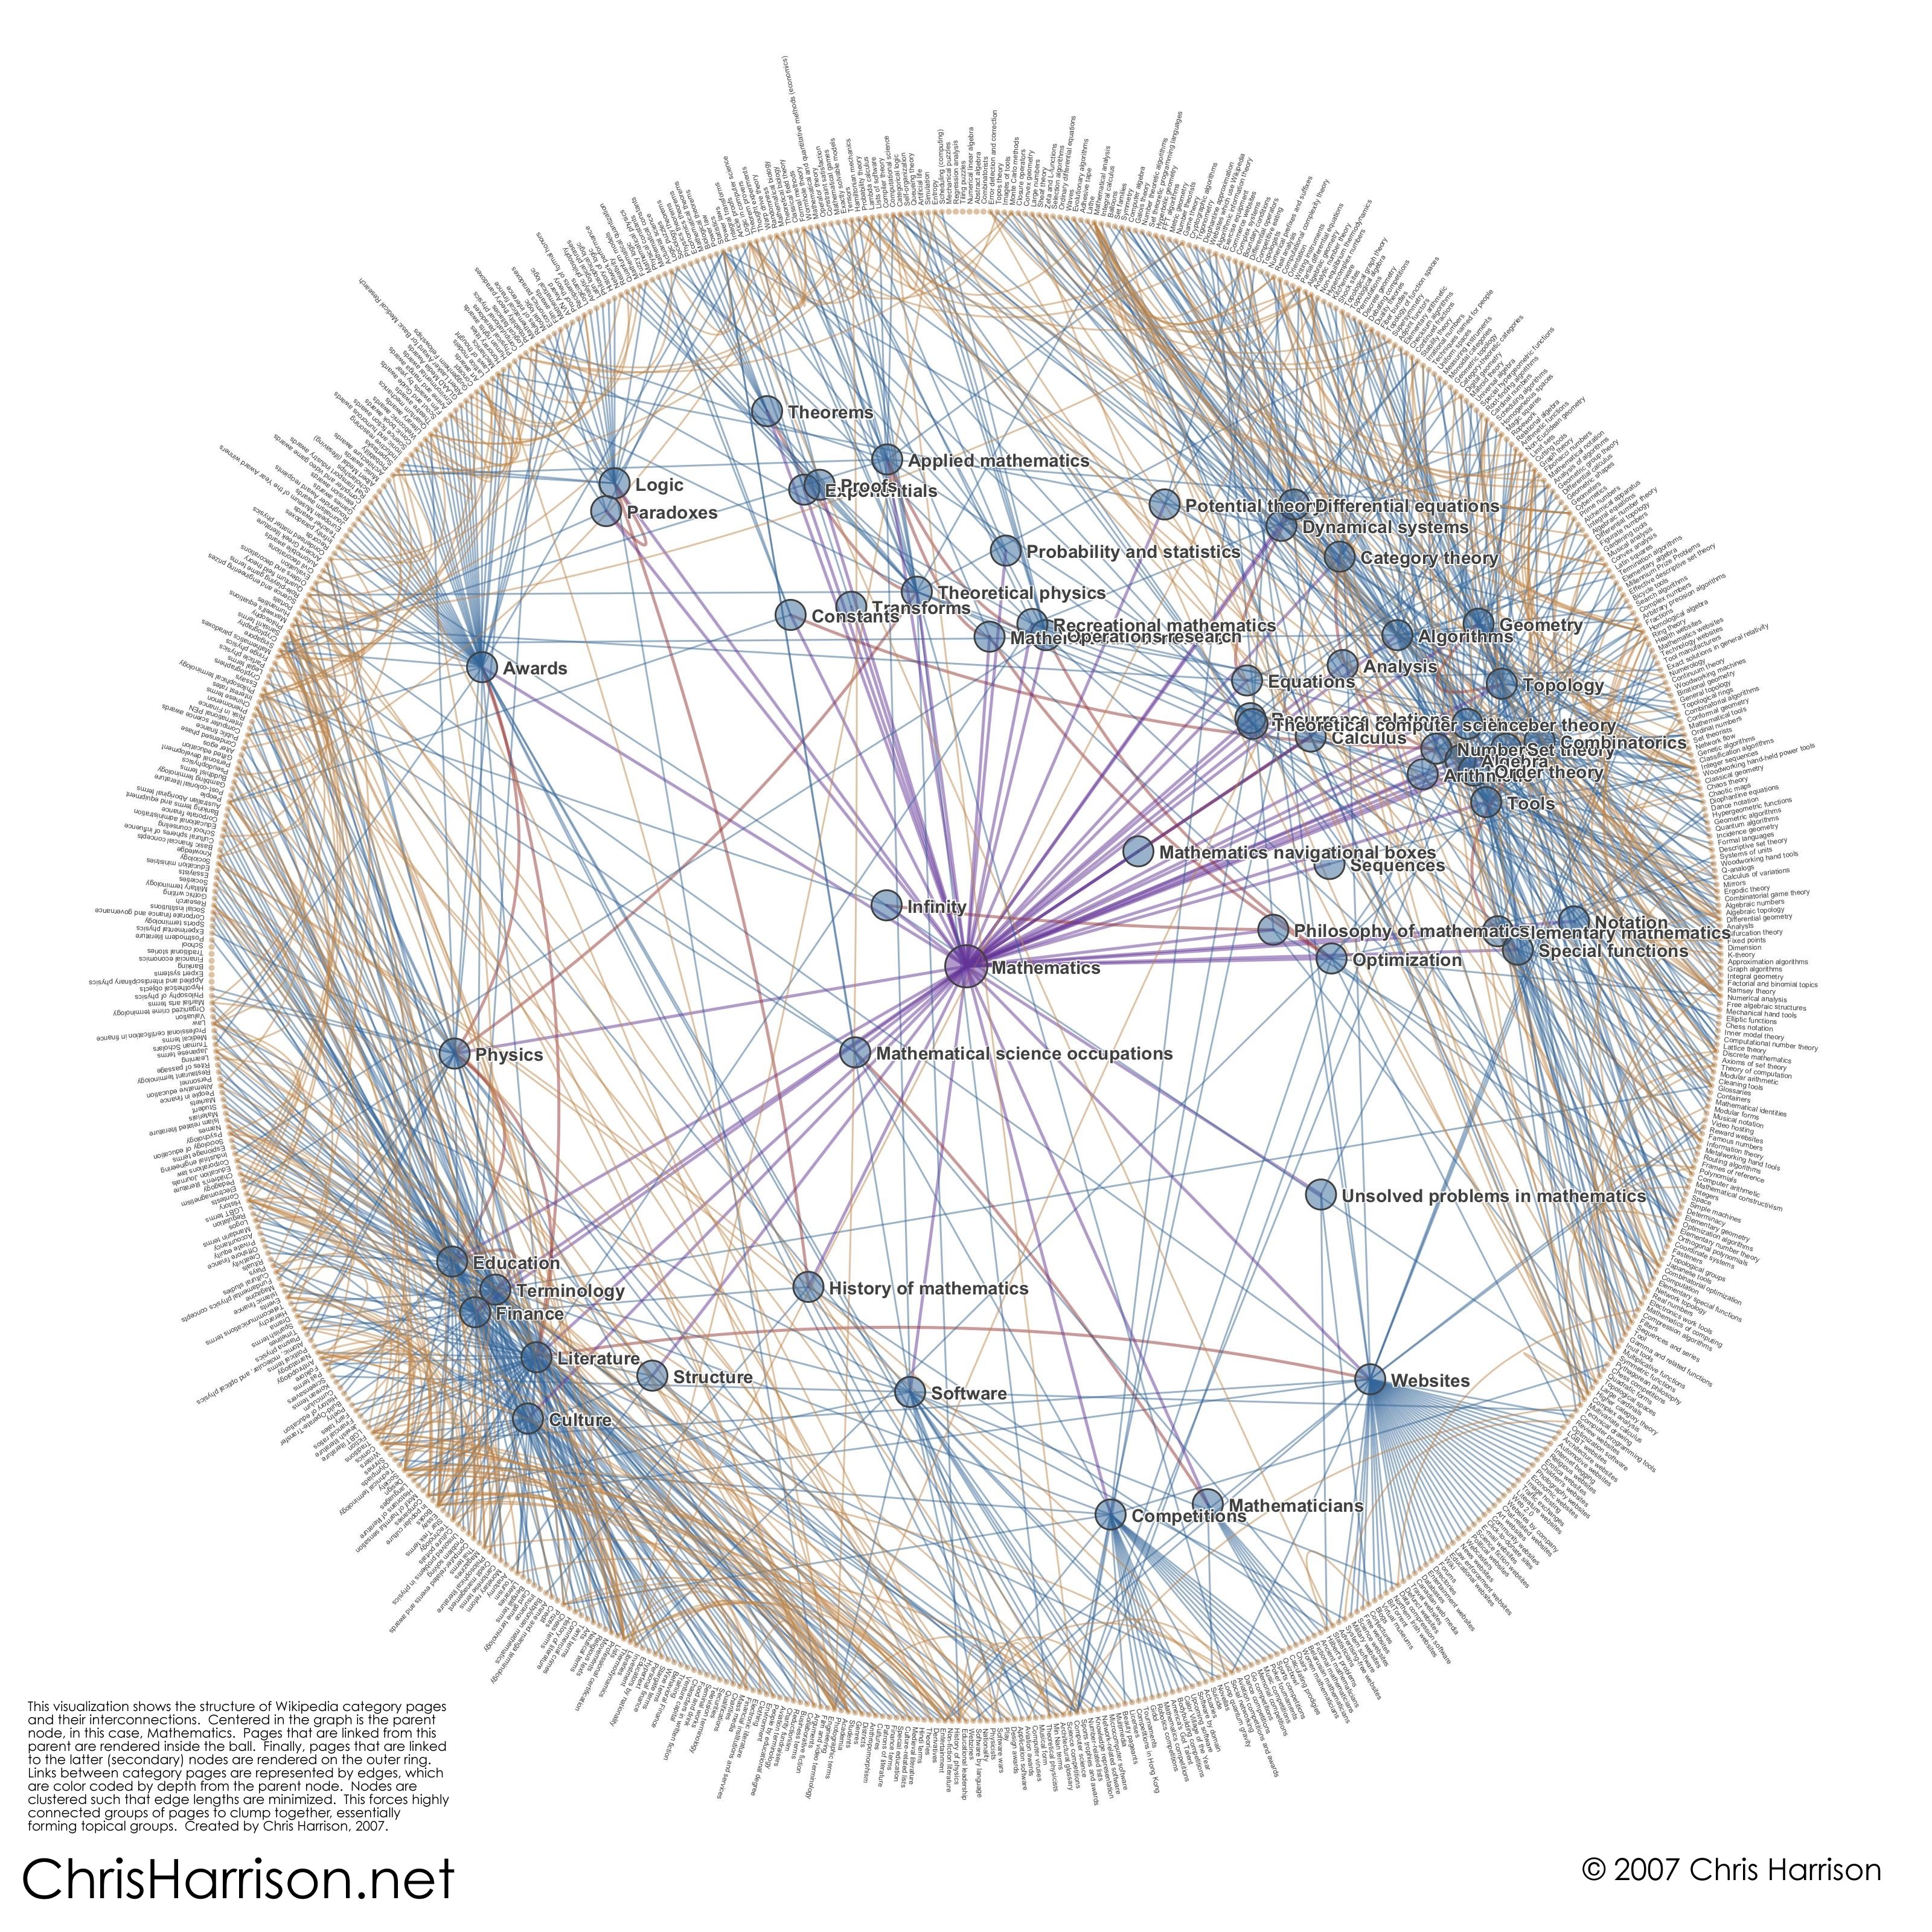 |  | 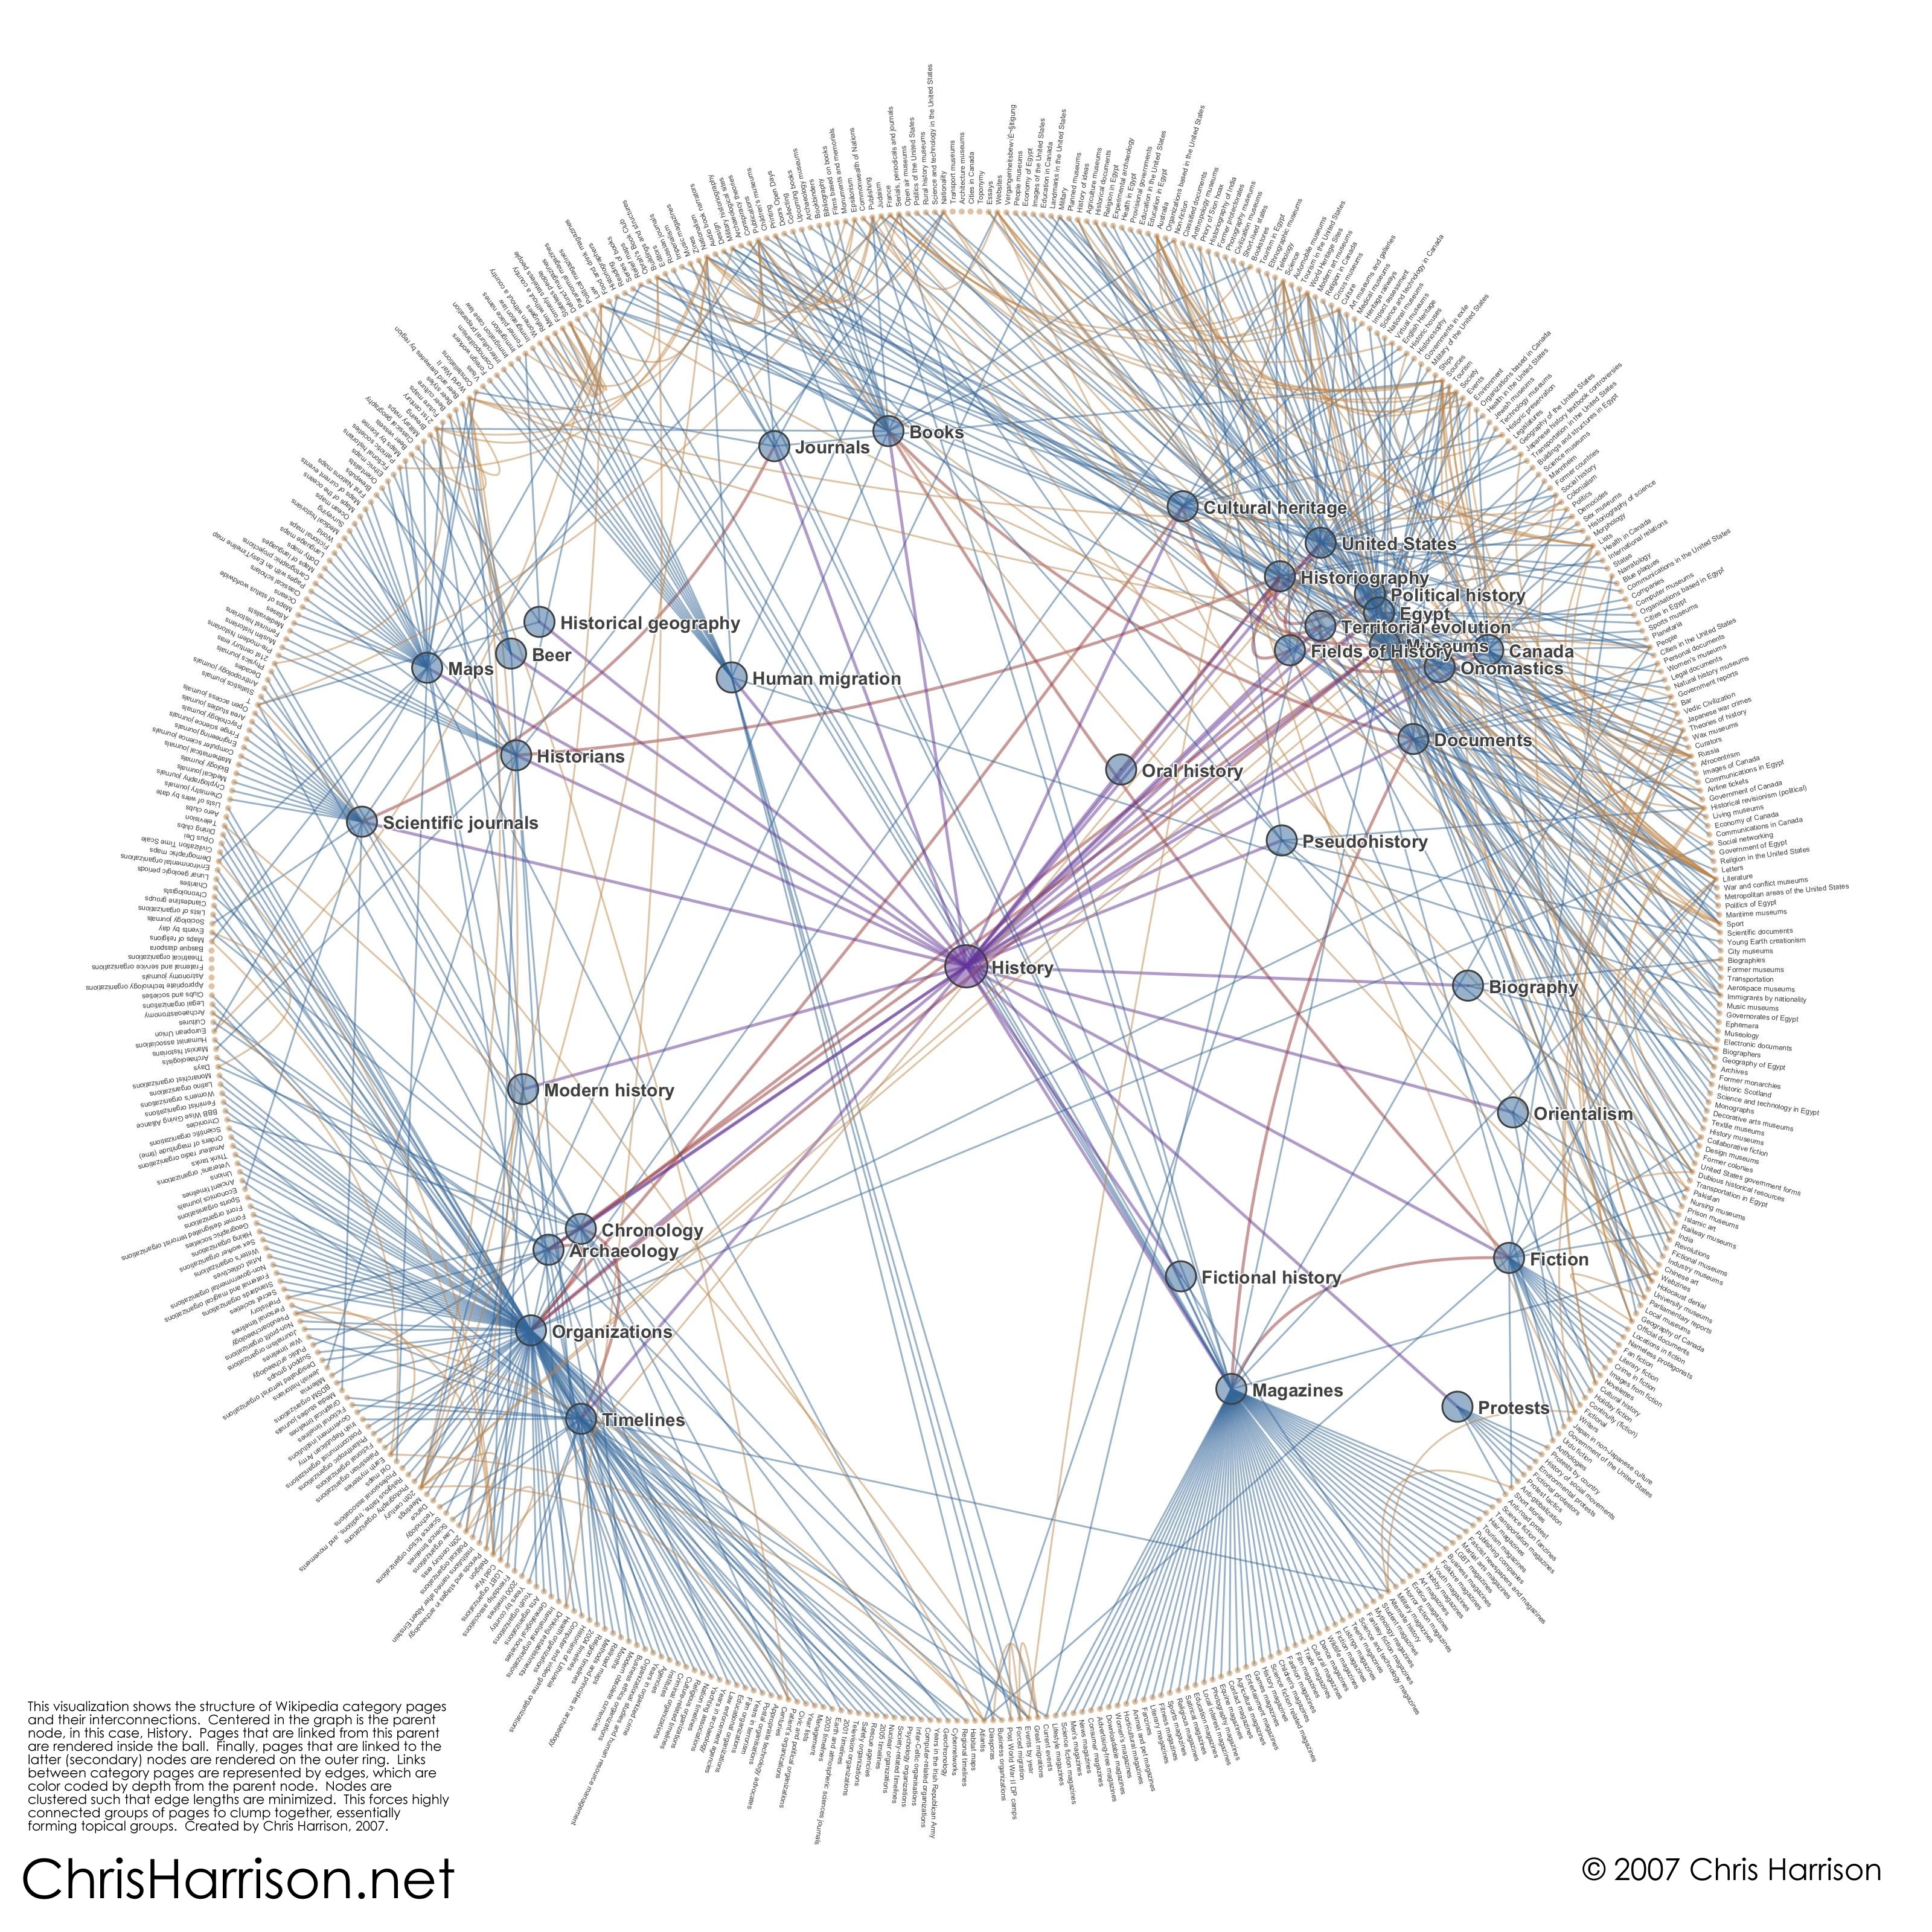 |
| Mathematics | Physics (see movie) | History |